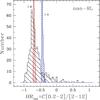
Fig. 7
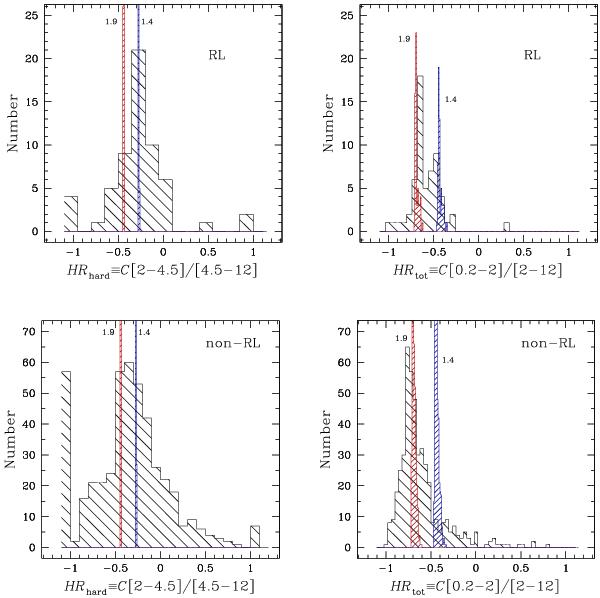
Distributions of hard (left panels) and total (right panels) hardness ratios. Observed HRs: black shaded histograms. As a comparison, we show the HRs expected for jet-dominated (Γ = 1.4, blue shaded histogram), and disk-dominated emission (Γ = 1.9, red shaded histogram). The HRs distributions have been calculated for RL (upper panels) and non-RL sources (excluding the non-classified objects; lower panels).
Current usage metrics show cumulative count of Article Views (full-text article views including HTML views, PDF and ePub downloads, according to the available data) and Abstracts Views on Vision4Press platform.
Data correspond to usage on the plateform after 2015. The current usage metrics is available 48-96 hours after online publication and is updated daily on week days.
Initial download of the metrics may take a while.