Fig. 6
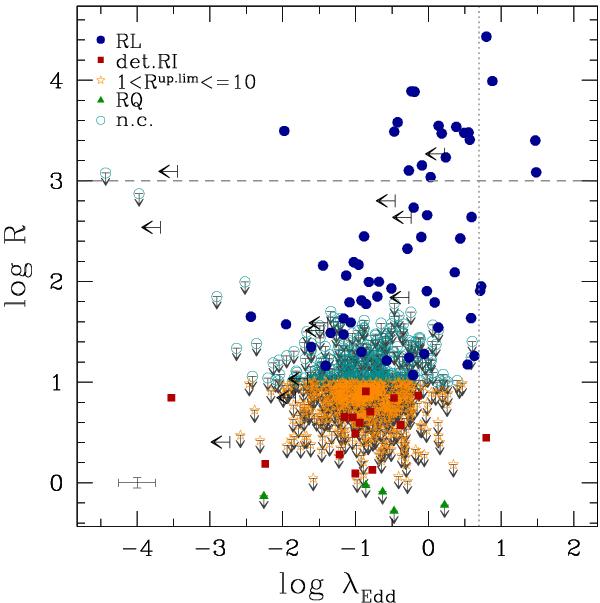
Radio-loudness parameters vs. Eddington ratios. Key as in Fig. 3: RL, blue filled circles; detected RI, red filled squares; undetected sources with ℛup.lim ∈ (1,10] , yellow open stars; RQ, green filled triangles; not classified, light-blue open circles. Undetected sources are also marked with small grey arrows. Only mean error bars are reported to avoid clutter. Big black arrows correspond to the upper limits found for the 11 X-ray non-detected sources in the “control sample”. The vertical dotted line marks the threshold of λEdd = 5, while the horizontal dashed line corresponds to ℛ = 1000.
Current usage metrics show cumulative count of Article Views (full-text article views including HTML views, PDF and ePub downloads, according to the available data) and Abstracts Views on Vision4Press platform.
Data correspond to usage on the plateform after 2015. The current usage metrics is available 48-96 hours after online publication and is updated daily on week days.
Initial download of the metrics may take a while.