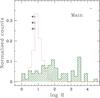
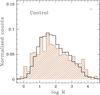
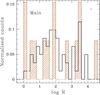
Fig. 5
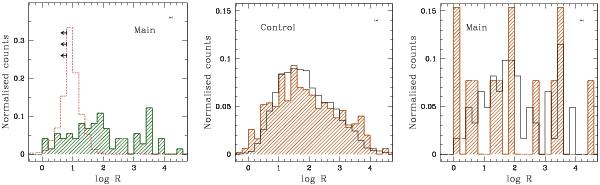
Normalised distributions of radio-loudness parameter ℛ, derived as described in Sect. 3; the error bars reported represent the mean uncertainties obtained as detailed in Sect. 3.4. Left panel: radio-detected (green shaded histogram) and radio-undetected (red dotted line) sources in the “main sample”. Central panel: ROSAT-detected (brown shaded histogram) and ROSAT-undetected (black continuous line) sources in the “control sample”. Right panel: radio-detected sources in the “main sample”, divided between ROSAT-detected (brown shaded histogram) and ROSAT-undetected (black continuous line).
Current usage metrics show cumulative count of Article Views (full-text article views including HTML views, PDF and ePub downloads, according to the available data) and Abstracts Views on Vision4Press platform.
Data correspond to usage on the plateform after 2015. The current usage metrics is available 48-96 hours after online publication and is updated daily on week days.
Initial download of the metrics may take a while.