Fig. 4
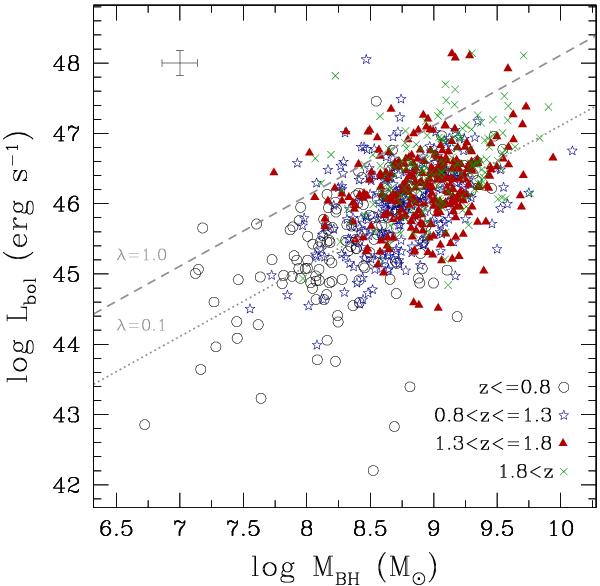
Bolometric luminosities vs. black hole masses for the sample of X-ray emitting type 1 AGN, divided in intervals of redshift (z ≤ 0.8, black open circles; 0.8 < z ≤ 1.3, blue open stars; 1.3 < z ≤ 1.8, red filled triangles; z > 1.8, green crosses). Only mean error bars are reported to avoid clutter. Grey dashed and dotted lines define the locus for sources emitting at the Eddington limit and at 1/10 of it.
Current usage metrics show cumulative count of Article Views (full-text article views including HTML views, PDF and ePub downloads, according to the available data) and Abstracts Views on Vision4Press platform.
Data correspond to usage on the plateform after 2015. The current usage metrics is available 48-96 hours after online publication and is updated daily on week days.
Initial download of the metrics may take a while.