Fig. 3
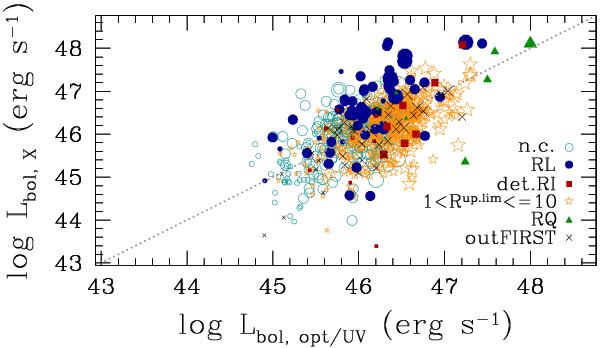
Lbol inferred from X-ray luminosity vs. Lbol derived from the optical/UV continuum for the sub-sample of QSOs (Shen et al. 2011). Different symbols mark radio classification (see Sect. 4): not classified, light-blue open circles; RL, blue filled circles; detected RI, red filled squares; undetected sources with ℛup.lim ∈ (1,10] , yellow open stars; RQ, green filled triangles; out of FIRST, black crosses. The symbol size increases with the redshift (z < 0.7, 0.7 ≤ z < 1.9, and z ≥ 1.9), therefore identifying the continuum wavelength adopted to obtain the bolometric luminosity (see the text). The dotted line marks the one-to-one relation between the luminosities.
Current usage metrics show cumulative count of Article Views (full-text article views including HTML views, PDF and ePub downloads, according to the available data) and Abstracts Views on Vision4Press platform.
Data correspond to usage on the plateform after 2015. The current usage metrics is available 48-96 hours after online publication and is updated daily on week days.
Initial download of the metrics may take a while.