Fig. 2
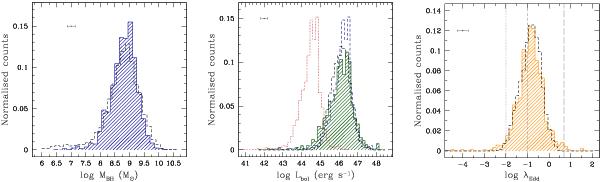
Nuclear properties, derived as described in Sect. 3; the error bars reported represent the mean uncertainties obtained as detailed in Sect. 3.4. Left panel: normalized distribution in BH mass (blue shaded histogram); the black dashed line shows the distribution for the “control sample”. Central panel: distribution in bolometric luminosity obtained assuming the luminosity-dependent κ2−10 keV in Eq. (2), green shaded histogram; the red dotted line and the blue dashed line represent the distributions in bolometric luminosity obtained assumed a constant κ2−10 keV = 1 (i.e., the distribution of the intrinsic hard X-ray luminosity) and κ2−10 keV = 50, respectively. The black dashed line shows the distribution in bolometric luminosity for the “control sample”, computed from optical/UV luminosities (Shen et al. 2011). Right panel: distribution in Eddington ratio (yellow shaded histogram); the black dashed line shows the distribution in Eddington ratio for the “control sample” (Shen et al. 2011). Grey dotted, dashed, and long-dashed vertical lines define the regions of λEdd < 0.01, 0.1 < λEdd < 5, and high-super-Eddington accretion, respectively.
Current usage metrics show cumulative count of Article Views (full-text article views including HTML views, PDF and ePub downloads, according to the available data) and Abstracts Views on Vision4Press platform.
Data correspond to usage on the plateform after 2015. The current usage metrics is available 48-96 hours after online publication and is updated daily on week days.
Initial download of the metrics may take a while.