Fig. 10
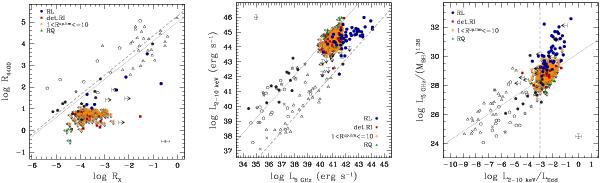
Left panel: relation between the radioloudness parameters ℛ4400 and ℛX; dotted and dashed grey lines are the best-fit regression lines found by Terashima & Wilson (2003) and Panessa et al. (2007), respectively. Central panel: radio vs. X-ray luminosity; dotted and dashed grey lines are the best-fit regression lines found by Panessa et al. (2007) for Seyfert and low-luminosity radio galaxies, respectively. Right panel: X-ray-to-Eddington luminosity ratio compared to the AGN fundamental plan; dotted line corresponds to the fundamental plane equation, by Merloni et al. (2003), while vertical dashed line marks the LX/LEdd where the switch in the accretion mode is expected. Key as in Fig. 3: RL, blue filled circles; detected RI, red filled squares; undetected sources with ℛup.lim ∈ (1,10] , yellow open stars; RQ, green filled triangles. Undetected sources are also marked with small grey arrows. Only mean error bars are reported to avoid clutter. Big black arrows correspond to the upper limits found for the 11 X-ray non-detected sources in the “control sample”. Our data are compared with the results found by Panessa et al. (2007) for a sample of low-luminosity AGN (grey symbols): filled and open polygons, Seyfert 1 and 2, respectively; open stars, Compton-thick candidates; crosses, “mixed Seyfert”; open triangles, low-luminosity radio galaxies.
Current usage metrics show cumulative count of Article Views (full-text article views including HTML views, PDF and ePub downloads, according to the available data) and Abstracts Views on Vision4Press platform.
Data correspond to usage on the plateform after 2015. The current usage metrics is available 48-96 hours after online publication and is updated daily on week days.
Initial download of the metrics may take a while.