Fig. C.3
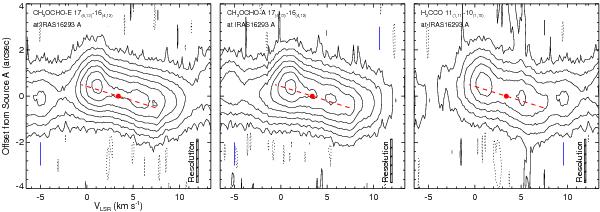
Position velocity maps of source A, along the direction shown in the rightmost panel of Fig. C.2, for the three lines studied. From left to right: CH3OCHO-A, CH3OCHO-E, and H2CCO. Contours are drawn to − 3, 3, 10, 22, 39, 61, 88, 120, and 157 times the rms noise, 4.5 mJy beam-1, where negative contours are plotted using dotted lines. The red dashed line and red solid circle show the 8 km s-1 arcsec-1velocity gradient and position of source A (VLSR = 3.4 km s-1), respectively. Notice that in all panels an adjacent molecular transition line is marked with a vertical blue line, which can also be identified in Fig. 2. The spatial resolution is shown at the bottom right corner.
Current usage metrics show cumulative count of Article Views (full-text article views including HTML views, PDF and ePub downloads, according to the available data) and Abstracts Views on Vision4Press platform.
Data correspond to usage on the plateform after 2015. The current usage metrics is available 48-96 hours after online publication and is updated daily on week days.
Initial download of the metrics may take a while.