Fig. 3
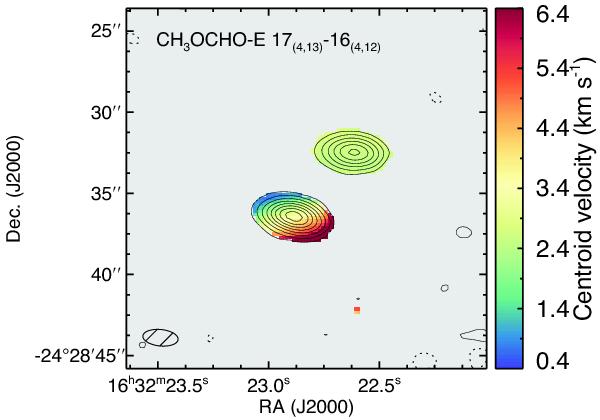
Intensity-weighted velocity for CH3OCHO-E. Contours are drawn to − 3, 3, 10, 22, 39, 61, 88, 120, and 157 times the rms noise of the integrated intensity, 15 mJy beam-1 km s-1, where negative contours are plotted using dotted lines. The beam size is shown at the bottom left corner. See Fig. C.2 for velocity maps of all three molecules.
Current usage metrics show cumulative count of Article Views (full-text article views including HTML views, PDF and ePub downloads, according to the available data) and Abstracts Views on Vision4Press platform.
Data correspond to usage on the plateform after 2015. The current usage metrics is available 48-96 hours after online publication and is updated daily on week days.
Initial download of the metrics may take a while.