Fig. 1
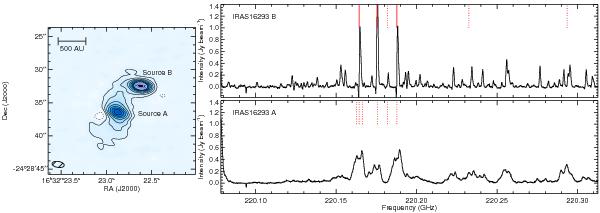
Left: continuum map of I16293 obtained at 220.1 GHz with ALMA. The synthesized beam is shown in the bottom left corner. The rms noise is 3.6 mJy beam-1in the central 20″ region of the map. Contours are drawn to − 3, 3, 10, 22, 39, 61, 88, 120, and 157 time the rms noise, where negative contours are plotted using dotted lines. The peak continuum flux densities for sources A and B are 0.539 ± 0.004 and 1.066 ± 0.004 Jy beam-1, respectively. Right: spectra of sources A and B are shown in the bottom and top panels, respectively. The rms noise in the line-free channels is 4.5 mJy beam-1. The red lines (solid and dotted) show the molecular transitions previously identified by Jørgensen et al. (2011), and the solid lines mark the transition where the inverse P-Cygni profile is found.
Current usage metrics show cumulative count of Article Views (full-text article views including HTML views, PDF and ePub downloads, according to the available data) and Abstracts Views on Vision4Press platform.
Data correspond to usage on the plateform after 2015. The current usage metrics is available 48-96 hours after online publication and is updated daily on week days.
Initial download of the metrics may take a while.