Fig. 8
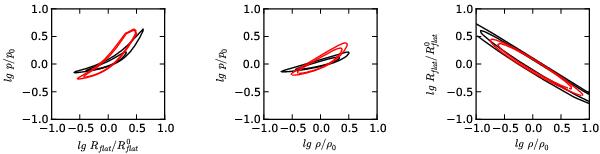
Plummer profile parameter correlations. Contours 1.5
 and 10
are
drawn for Plummer profile fits obtained from WFCAM AV
map (black lines) and Herschel column density map (red lines). In
each case we fix one of the three Plummer parameters
(ρc, Rflat
or p) and change the others. The axes show parameter values
relative to those of the (see
Table 1 for the precise values of the
parameters).
and 10
are
drawn for Plummer profile fits obtained from WFCAM AV
map (black lines) and Herschel column density map (red lines). In
each case we fix one of the three Plummer parameters
(ρc, Rflat
or p) and change the others. The axes show parameter values
relative to those of the (see
Table 1 for the precise values of the
parameters).
Current usage metrics show cumulative count of Article Views (full-text article views including HTML views, PDF and ePub downloads, according to the available data) and Abstracts Views on Vision4Press platform.
Data correspond to usage on the plateform after 2015. The current usage metrics is available 48-96 hours after online publication and is updated daily on week days.
Initial download of the metrics may take a while.