Fig. 1
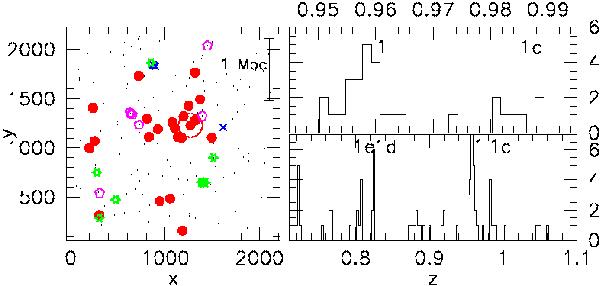
Left panel: spatial distribution of galaxies in the whole field. Pixel positions for galaxies are given. The units on the axes are pixels = 0.2′′. North is up and east is to the left. The structures identified are indicated with the different colors. Black points: all galaxies in the spectroscopic catalog. Red dots: main cluster, “1”. Empty magenta pentagons: “1c”. Green skeletal stars: “1d”. Blue crosses: “1e”. The size of 1 Mpc at z = 0.95 is also shown. The BCG of the main cluster is also indicated with an empty red circle. Lower right panel: redshift histogram of the whole field. The position of the structures identified in the field is also indicated. Upper right panel: redshift histogram of the structures 1 and 1c, which are the structures analyzed in the paper.
Current usage metrics show cumulative count of Article Views (full-text article views including HTML views, PDF and ePub downloads, according to the available data) and Abstracts Views on Vision4Press platform.
Data correspond to usage on the plateform after 2015. The current usage metrics is available 48-96 hours after online publication and is updated daily on week days.
Initial download of the metrics may take a while.