Fig. 2
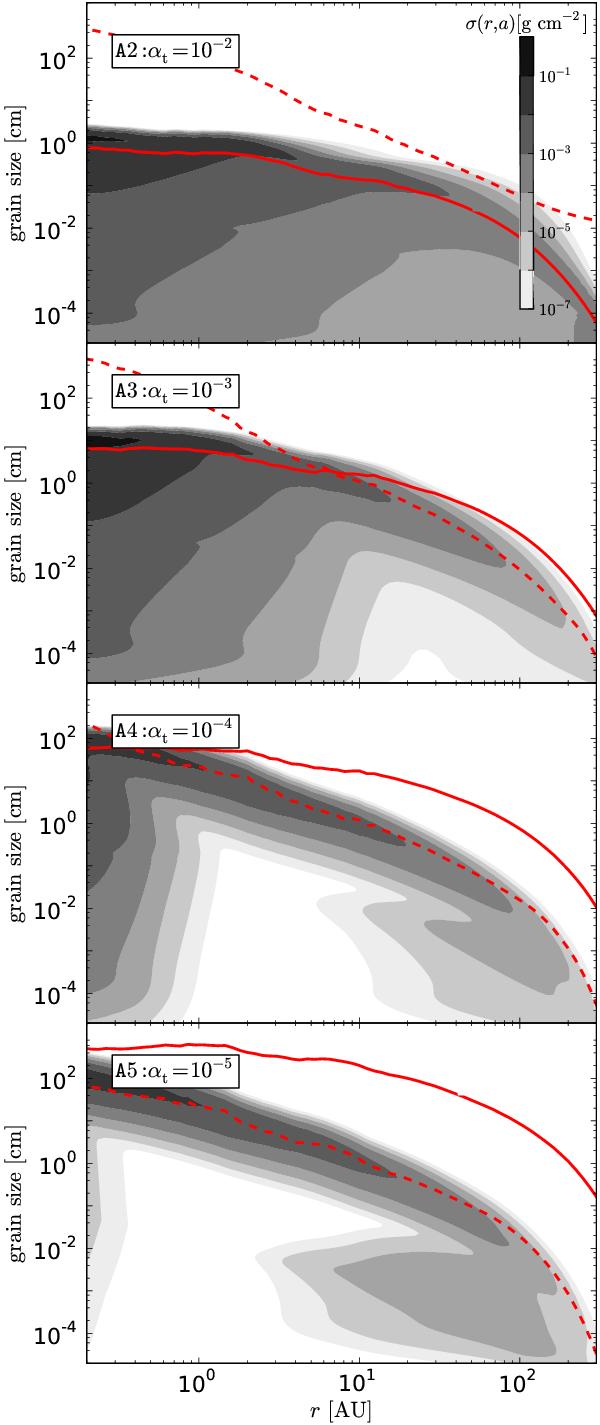
Vertically integrated dust surface density distribution after 5 Myr of evolution for the simulations without a dead zone, A2 (top) to A5 (bottom). The parameters for the simulations are shown in Table 1. The solid red line denotes the growth barrier set by grain fragmentation, the dashed red line the size limit due to radial drift.
Current usage metrics show cumulative count of Article Views (full-text article views including HTML views, PDF and ePub downloads, according to the available data) and Abstracts Views on Vision4Press platform.
Data correspond to usage on the plateform after 2015. The current usage metrics is available 48-96 hours after online publication and is updated daily on week days.
Initial download of the metrics may take a while.