Fig. 5
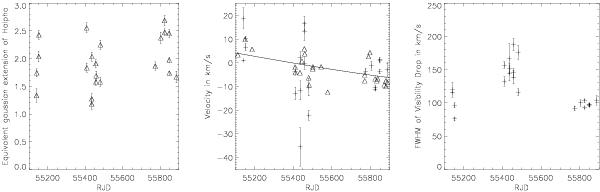
In Figs A.1–A.3, we fit a Gaussian curve for the visibility drop in the Hα line. The left panel presents, as a function of the reduced heliocentric Julian date, the size in mas of the Hα region deduced from the minimum of visibility and modeled as a Gaussian function. In the middle panel we show the evolution of the velocity shift for the minimum of visibility (△ ) overplotted with the radial velocity determined by spectroscopy directly (+ signs). The solid line represents the radial velocity of the F star orbital motion. In the right panel, the width in velocity of the visibility drop is displayed. In all 3 panels, the horizontal scale is the reduced heliocentric Julian date.
Current usage metrics show cumulative count of Article Views (full-text article views including HTML views, PDF and ePub downloads, according to the available data) and Abstracts Views on Vision4Press platform.
Data correspond to usage on the plateform after 2015. The current usage metrics is available 48-96 hours after online publication and is updated daily on week days.
Initial download of the metrics may take a while.