Fig. 3
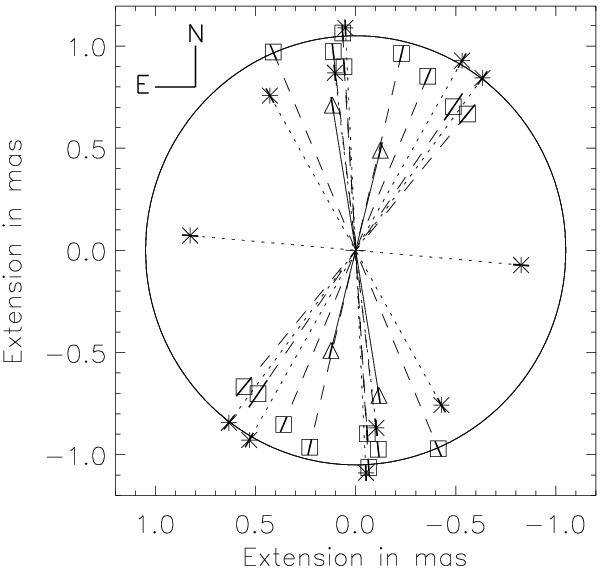
The uniform disk equivalent angular diameter as a function of time (* and dotted line = november 2009, △ and solid line = october 2010, Λ and dashed line = october 2011). The axis are labeled in mas. The data are presented along the position angle of the baseline at the time of observation. The size of the small segments correspond to the uncertainty. The circle corresponds to an angular diameter of 2.1 mas.
Current usage metrics show cumulative count of Article Views (full-text article views including HTML views, PDF and ePub downloads, according to the available data) and Abstracts Views on Vision4Press platform.
Data correspond to usage on the plateform after 2015. The current usage metrics is available 48-96 hours after online publication and is updated daily on week days.
Initial download of the metrics may take a while.