Fig. 2
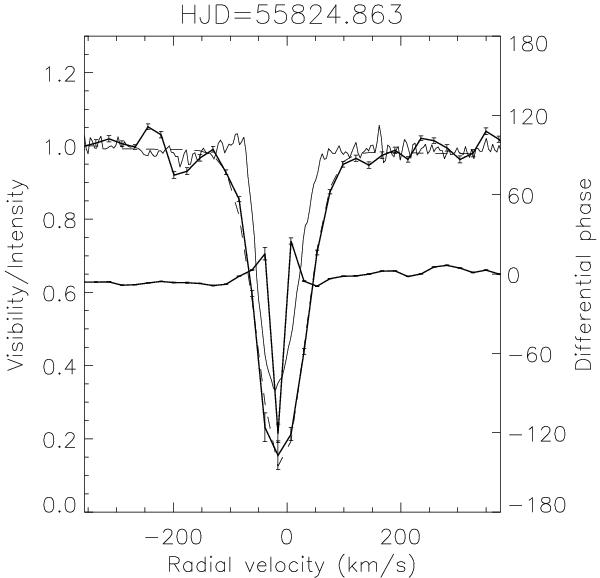
Example of the differential visibility measurement obtained on ε Aur in high spectral resolution mode around the Hα line. The left vertical scale is for the relative intensity of the line profile (thin curve) and for the differential visibility amplitude relative to continuum (thick curve close to 1 at the minimum and maximum radial velocity). A Gaussian function (dashed curve) is fitted to the differential visibility amplitude. The right vertical scale corresponds to the differential phase measurements in degree (thick curve close to 0 at the minimum and maximum radial velocity).
Current usage metrics show cumulative count of Article Views (full-text article views including HTML views, PDF and ePub downloads, according to the available data) and Abstracts Views on Vision4Press platform.
Data correspond to usage on the plateform after 2015. The current usage metrics is available 48-96 hours after online publication and is updated daily on week days.
Initial download of the metrics may take a while.