Free Access
Fig. 1
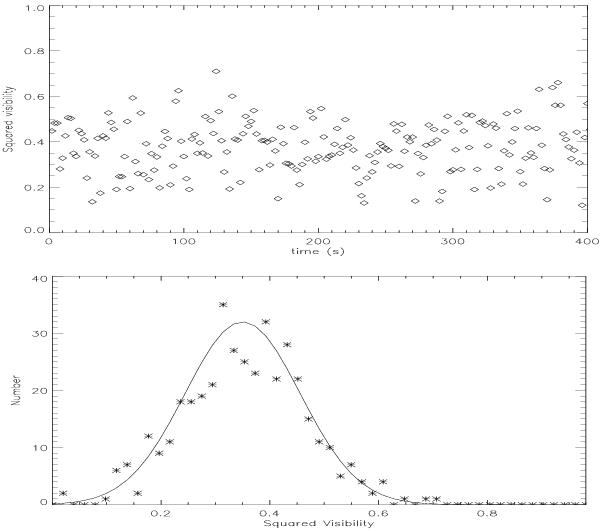
Top: raw V2 measurements as a function of time for the calibrator on the night of Nov. 17th, 2009 at UT 12:17. Bottom: histogram of the V2 values of the previous sample. A Gaussian fit is superimposed on the data points.
This figure is made of several images, please see below:
Current usage metrics show cumulative count of Article Views (full-text article views including HTML views, PDF and ePub downloads, according to the available data) and Abstracts Views on Vision4Press platform.
Data correspond to usage on the plateform after 2015. The current usage metrics is available 48-96 hours after online publication and is updated daily on week days.
Initial download of the metrics may take a while.