| Issue |
A&A
Volume 544, August 2012
|
|
|---|---|---|
| Article Number | A136 | |
| Number of page(s) | 11 | |
| Section | Interstellar and circumstellar matter | |
| DOI | https://doi.org/10.1051/0004-6361/201219191 | |
| Published online | 14 August 2012 | |
A southern hemisphere survey of the 5780 and 6284 Å diffuse interstellar bands: correlation with the extinction⋆,⋆⋆,⋆⋆⋆
1 Université Versailles Saint-Quentin, LATMOS/IPSL, 11 Bd d’Alembert, 78200 Guyancourt, France
2 GEPI Observatoire de Paris, CNRS, Université Paris Diderot, Place Jules Janssen, 92190 Meudon, France
e-mail: This email address is being protected from spambots. You need JavaScript enabled to view it.
3 ACRI-ST, 260 route du Pin Montard, Sophia-Antipolis, France
4 Observatoire de Genève, Université de Genève, Chemin des Maillettes 51, 1290 Sauverny, Switzerland
Received: 8 March 2012
Accepted: 22 June 2012
Abstract
Aims. Diffuse interstellar bands (DIBs) measured in stellar spectra contain information on the amount of interstellar (IS) matter that is distributed along the line-of-sight, and similarly to other absorbing species may be used to locate IS clouds. Here we present a new database of 5780.5 and 6283.8 Å DIB measurements. Those two DIBs have the advantage that they are strong and also broad enough to be detectable in cool-star spectra. We also study their correlation with the reddening.
Methods. The database is based on high-resolution, high-quality spectra of early-type nearby stars located in the southern hemisphere at an average distance of 300 pc. Equivalent widths of the two DIBs were determined by means of a realistic continuum fitting and synthetic atmospheric transmissions. For all stars that possess a precise measurement of their color excess, we compare the DIBs and the extinction.
Results. We find average linear relationships of the DIBS and the color excess based on ≃120 and 130 objects that agree well with those of a previous survey of ≃130 northern hemisphere stars closer than 550 pc. Because our target sky coverage is complementary, this similarity shows that there is no significant spatial dependence of the average relationship in the solar neighborhood within ≃ 600 pc. A noticeably different result is our higher degree of correlation of the two DIBs with the extinction, especially for the 5780 Å DIB. We demonstrate that it is simply due to the lower temperature and intrinsic luminosity of our targets. Using cooler target stars reduces the number of outliers, especially for nearby stars, confirming that the radiation field of UV bright stars has a significant influence on the DIB strength. We illustrate the potential use of 3D maps of the ISM for characterizing the DIB sites. There is some evidence that interstellar cavity boundaries are DIB-deficient, although definite conclusions will have to wait for maps with a higher resolution. Finally, we have used the cleanest data to compute updated DIB shapes.
Key words: dust, extinction / stars: fundamental parameters / local insterstellar matter / ISM: lines and bands
Based on observations collected at the European Southern Observatory, La Silla, Chile.
Full Table 1 is available in electronic form at http://www.aanda.org
Profiles of the DIBs for each star are only available at the CDS via anonymous ftp to cdsarc.u-strasbg.fr (130.79.128.5) or via http://cdsarc.u-strasbg.fr/viz-bin/qcat?J/A+A/544/A136
© ESO, 2012
1. Introduction
Identifying the diffuse interstellar bands (DIBs), the ≃ 400 weak absorption features seen in the spectra of reddened stars (Hobbs et al. 2008, 2009) remains one of the longest-standing spectroscopic problems in astrophysics, and today they are still widely studied with the aim of conclusively identifying their carriers in the interstellar medium (ISM). If large molecules are preferentially designated (Léger & D’Hendecourt 1985), nothing has been decisively established as yet on their actual structures and sizes, on their participation from the gaseous or solid phase, on the role of the charge state balance, etc. (for summaries see Herbig 1995; Jenniskens & Desert 1994; Salama et al. 1996; Fulara & Krelowski 2000; Snow & Destree 2011; Friedman et al. 2011, hereafter FR11, and references therein). Clues to their origin have been investigated in different ways. Laboratory spectra and models of rotational excitation of molecules have been compared to observations with the aim of finding convincing matches (see the recent review by Sarre 2006). Polarization studies aim at constraining the carrier phase, with most results pointing against the solid state (Smith et al. 1977; recently Cox et al. 2006, 2011).
At the same time, the DIBs are studied toward specific targets or for large statistical samples of stars with the aim of establishing correlations with other interstellar tracers and identifying families among the DIBS that are characterized by similar correlations. Sightline categories have been identified, in particular the so-called σ- and ζ-type sightlines which have specific associations of DIB properties and UV extinction laws (Krelowski & Sneden 1994). ζ-type sightlines correspond to UV-shielded cloud cores while σ-type sightlines probe cloud external regions that are partially ionized by the UV radiation field. The influence of the radiation field has been recently studied by Vos et al. (2011) based on stars from the upper Scorpius subgroup of the Sco OB2 association. These authors established significant differences between the properties of the two groups in terms of DIB-DIB, DIB-extinction, and DIB-gas relationships.
These relationships have also been found based on sky-distributed datasets: links between the strengths of some DIBs and HI, H2, KI, NaI or C2 columns, between some of the DIBs and the dust column traced by the color excess, or between DIBS themselves have been found by several authors (e.g. Krelowski & Walker 1987; Thorburn et al. 2003; Welty et al. 2006; Friedman et al. 2011; McCall et al. 2010). The influence of the UV radiation field of the target stars has again found to be significant. In addition to the potential destruction of the carriers by energetic photons, the combination of the charge state and the carrier size is thought to play a major role in a number of DIBs (Galazutdinov et al. 2004; Salama et al. 1996).
Instead of focusing on DIB properties and their differential behaviors that may give clues to their carriers, it is a more practical aspect that has motivated the present statistical work. Although correlations between the DIB strengths and the color excesses or the gas columns may be weak, DIBS are carrying some information on the quantity of matter along the path to a target star. In the same way that neutral sodium has been used to build local ISM maps (Welsh et al. 2010; Vergely et al. 2010), despite the absence of a strong correlation between neutral sodium and H columns, DIB absorption strengths toward stars at increasing distances can be used to determine IS cloud locations. Forthcoming extensive stellar datasets and hopefully parallaxes from the ESA Gaia mission will open the way to constructing precise 3D maps of the galactic dust by means of the inversion method (Vergely et al. 2001). These maps will in turn be useful for the interpretation of the stellar surveys, by helping to break the degeneracy between the star temperature and the reddening. Our aim is to build new derivation methods of the DIBS in all stellar spectra, to help constraining the 3D mapping, and in parallel to study the relationships between the DIB strengths and other IS parameters in more detail and to cover all various ISM cloud types and locations in the Galaxy.
Here we complement previous statistical studies of two strong DIBS by an analysis of southern hemisphere high-quality, high-spectral resolution data, and in particular to compare the results with the recent results of an extensive northern hemisphere survey presented by FR11, and of a survey dedicated to the Upper Scorpius area (Vos et al. 2011). While the FR11 survey aimed at detailed studies of DIB-to-DIB pairwise correlations, as part of a search for DIB carrier identification, our data were recorded with the aim of building a three-dimensional map of the nearby ISM. This is why the choice of the targets is drastically different (see Sect. 4). Because we are using nearby targets with low reddening, we focused on two of the strongest bands in the red domain. Both have been studied by several authors, and in particular by FR11. They are those that probably are the most readily extractable from survey data such as the Gaia-ESO spectra, especially for cool stars, because the DIBS in this case must be broader than the stellar lines.
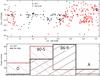 |
Fig. 1 Location of our FEROS targets (red circles), and comparison with the FR11 survey targets (black crosses). Also shown are the distributions of stellar types (bottom). |
In Sect. 2 we describe the spectroscopic dataset used throughout the paper. In Sect. 3, we explain the cleaning and fitting techniques that led to the extraction of the DIBs. We also describe a new method to estimate the error induced by fitting a continuum to both sides of the DIB. In Sect. 4 we describe the correlative studies based on this new dataset, and the combination with the previous measurements of FR11. In Sect. 5 we discuss our results and some potential improvements, in particular, attempts to identify the ISM environments that lead to substantial deviations from the average trends.
2. Observations
Our measurements were extracted from a database of 500 high signal-to-noise (S/N ≥ 100), high-resolution (R ≃ 48 000) spectra of nearby stars, mostly located within 400 parsecs, acquired with the FEROS spectrograph at the ESO/Max Planck 2.2 m telescope in La Silla (LP179.C-0197 program, total 15 nights, ended February 2009). The aim of this survey was developing an interstellar gas absorption database and subsequently producing of a three-dimensional map of the local ISM. Interstellar neutral sodium and singly ionized calcium have been measured in those spectra by means of profile-fitting techniques and combined with previous existing data to provide local maps (Vergely et al. 2010; Welsh et al. 2010). To facilitate interstellar line identification and fitting, the spectral types range from early B to A5, with fast rotators preferentially selected for the latest types (see the distribution of stellar types in Fig. 1).
These high-quality data are also perfectly suited for spectroscopic studies of the strongest diffuse bands, provided the target stars are sufficiently reddened for the DIBS to be detectable. Figure 2 shows typical examples of the spectral intervals containing the λλ 5780.4 and 6283.8 diffuse bands. Thanks to the weakness of the stellar lines and the resulting smooth continua, the 5780.4 Å DIB can be extracted very easily when it dominates the noise, with the exception of some of the latest stellar type targets for which three stellar lines contaminate the DIB spectral interval. On the other hand, the 6284.8 Å DIB is very strongly contaminated by telluric molecular oxygen lines, but thanks to the high resolution and the sharpness of those lines the DIB is measurable, provided one correctly removes the telluric absorptions.
This dataset is also ideally adapted to statistical studies. The target stars are randomly distributed in the sky and in distance because of mapping requirements. Figure 1 shows the location of the target stars that possess precise extinction data (see below). Superimposed are the Friedman et al. (2011) targets that formed the basis of their correlative studies. Evidently, the two stellar datasets are spatially complementary, which is essentially due to the locations of the two observatories, the northern hemisphere Apache Point and the southern hemisphere La Silla Observatories. This complementarity is used here to test the variability of the DIBS with location. Our survey is restricted to targets with measurable DIBs and a reddening determination (see Sect. 5). Because the difficulties associated with the two DIBS are of a different origin (stellar lines vs. telluric lines, see next section), for a few stars only one of the two DIBS was measured.
Stellar data and measurements.
 |
Fig. 2 Illustrations of the DIB equivalent width measurements. The top (bottom) graphs show the spectra before (after) normalization, i.e., division by the fitted continuum. The hatched areas correspond to the measured equivalent widths. (Left) A typical continuum fitting and EW extraction of the 5780 Å DIB. (Middle) Example of removing contaminating stellar lines for the late-B target stars. (Right) Example of telluric line removal by means of a synthetic transmission for the 6284 Å DIB and the subsequent EW measurement. |
3. Data analysis
3.1. The 5780 Å diffuse band
The 5780 Å absorption is one of the strongest DIBs and has been already measured toward bright stars at various distances. It is about 3.5 Å wide (full width) and, as said above, is contained in a spectral region that is mostly free of stellar lines for the majority of our targets (Fig. 2), with the exception of three FeII stellar lines that appear in late-B objects and may be strong enough to contaminate the band significantly. The 5780 Å DIB has been shown by FR11 to be fairly well correlated with the neutral gas column and less well correlated with the extinction. Vos et al. (2011) show that for targets of the Upper Scorpius OB association the DIB is significantly weaker in ζ-type sightlines (i.e. UV-shielded central parts of the IS clouds).
The equivalent width (EW) is classically measured by fitting the stellar continuum on both sides of the main DIB absorption (see Fig. 2). Following FR11, we considered the 5778.0 to 5784 Å interval. The EW was computed based on the normalized spectrum. For all targets we carefully searched for the potential contaminating stellar lines, using the fact that the third line at 5784.45 Å is shifted out of the DIB and can be easily detected (see Fig. 2). When the lines are too broad and strong to permit an accurate measurement of the DIB, we excluded the corresponding target. When they are narrow enough to allow a reliable correction, as in the example shown in Fig. 2, we applied a mask as illustrated in the figure and replaced the spectrum by a straight line within the spectral intervals of the stellar features. The error on the DIB equivalent width associated with this procedure is conservatively estimated to be less than 10% of the removed stellar line EW for the whole dataset.
The target stars and the derived equivalent widths are listed in Table 1. Among the 500 targets, about 200 stars have measurable λλ 5780.4 diffuse bands. For a signal-to-noise (S/N) of ≃ 100, our minimum equivalent width and error is about 3 mÅ and is essentially caused by uncertainties on the shape of the stellar continuum in this area. This limit is reflected in the data point dispersion at very low reddening values. For the targets that are too close and whose ISM column is too small, the corresponding threshold is about E(B − V) ≃ 0.05 (see Fig. 3).
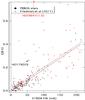 |
Fig. 3 Johnson color excess as a function of the 5780 Å DIB equivalent width for our FEROS stars (black filled circles). Also shown are the results of FR11 (red plus signs) for equivalent widths lower than 230 mÅ. Stars beyond 400 parsecs are indicated by small markers. Dashed and solid lines are the linear correlations for the FR11 et FEROS data. The FEROS correlation corresponds to the ODR method and all data. The FR11 correlation is for case (3) of Table 2. |
3.2. The 6284 Å diffuse band
According to FR11, the broad 6284 Å band is slightly less correlated with HI and also the reddening compared to the 5780 Å DIB. We used a synthetic telluric transmission to correct for the narrow lines that contaminate the 6284 Å DIB spectral region (see Fig. 2). This transmission was computed using the LBLRTM code (Line-By-Line Radiative Transfer Model, Clough et al. 2005) and the HITRAN (HIgh-Resolution TRANsmission molecular absorption, Rothman et al. 2009) spectroscopic database for a standard atmospheric profile and the altitude of La Silla. For each star we modified the atmospheric transmission to take into account the terrestrial line Doppler shift and the instrumental width and adjusted it to the airmass by means of an automatic fitting routine. In this way, all lines vary in the same proportions, i.e., we did not allow a differential variability among the various lines. Because a small differential variability is present for some lines, the removal of the entire series of telluric lines is not perfect (see Fig. 2), but it is by far sufficient for our purpose. The adopted correction is the one for which the length (defined as the sum of distances between consecutive points) of the residual spectrum obtained after division of the initial spectrum by the transmission, reaches a minimum.
Correlations with E(B − V).
The 6284 Å DIB is on average twice as strong as than the 5780 Å DIB. However, it is also significantly broader, and finally shallower on average than the 5780 Å absorption. Moreover, the telluric line removal procedure introduces some noise that also tends to reduce its detectability. This explains why, among all targets, only about 130 stars have measurable λλ 6284 diffuse bands. For a S/N of ≃100, our limit for the equivalent width is about 3 mÅ similar to the 5780 Å DIB. The derived equivalent widths are listed in Table 1. The interval for the DIB that is considered here is the same as in FR11, namely 6275−6292 Å.
4. Error estimates
Uncertainties on the equivalent width measurements have two main origins. A first source of uncertainty is linked to the signal-to-noise and the width of the DIB and can be calculated in a straightforward way. For the 5780 and 6284 Å DIBs those errors are about 3 and 5 to 10 mÅ, respectively. The error on the second DIB is larger as a consequence of the broader width and the telluric line correction. The second source of uncertainty is the continuum adjustment and is much more difficult to estimate. It depends on the large-scale features in the spectrum that may have various origins: imperfections of the reduction, fringes, stellar features, presence of lines from a companion, etc. Anything that renders the spectrum different from a very smooth curve that can be extrapolated from the spectral intervals on both sides of the DIB may lead to a slight error in the continuum shape (esp. the curvature) and a subsequent error on the EW.
We devised and performed a new method to estimate these uncertainties that we call the sliding windows error estimate, based on the assumption that the departures from the smooth continuum adjusted to the DIB sides that are present at the DIB location must also be present elsewhere in the spectrum. Within this assumption, one way to estimate potential errors on the continuum placement is to use a large part of the spectrum and perform continuum fittings similar to those used at the DIB location, but this time at many locations without DIB absorptions. By similar, we mean based on the same wavelength intervals that are used on the two sides of the DIB. This change of locations is made by simply shifting the intervals all along the spectrum. For each of the sliding windows locations a continuum fitting is performed, and the equivalent width comprised between the fitted continuum and the actual spectrum (which should be null if the fitted continuum were perfectly adjusted) is computed and stored. The entire set of locations provides many error values, from which we extracted a standard deviation.
We combined the two errors quadratically and the results are quoted in Table 1. Because the error obtained when using the sliding windows method is in most cases larger than the first error caused by the noise only, the final error is close the sliding windows value. We note that while all continua were adjusted by eye with different polynomial laws and spectral intervals from one star to the other, the quoted errors were been obtained by means of a unique automatic code applied to all stars, for a linear continuum and two 3 Å wide windows. Since this method provides a very conservative value, we believe it is representative of maximum errors associated to the actual determinations. For a few stars that have a cold companion, the automated method provides unrealistically high values because it integrates sharp stellar lines. In this case we used the maximum error obtained for all other objects.
5. Correlations with the color excess E(B–V)
For the sake of homogeneity, we restricted the correlation to a set of targets for which the extinction was determined based on the same photometric system and calibration method. We used here the extensive database of bright stars observed in the seven-colors Geneva photometric system and the associated color excess determinations (Cramer 1999; Burki & Cramer 2012, priv. comm.). One hundred and thirty-five targets simultaneously possess an E(B − V) determination and a measurable 5780 Å DIB, while 120 targets possess an E(B − V) and a measurable 6283.8 Å DIB. Because the Geneva photometric system is slightly different from the other systems, we cross-correlated the Geneva color excess values with the Strömgren E(b − y) determinations for all common targets and derived a linear correspondency between those quantities. The relationship between the Johnson E(B − V) and the Strömgren E(b − y) was taken from Vergely et al. (2010). In Table 1 are listed the color excess values, along with the target star galactic coordinates and the DIB equivalent width measurements. We kept the error on the color excess that is associated to the calibration itself, which excludes any dispersion due to stellar intrinsic variabilities that cannot be taken into account. Those errors are fairly small, while the dispersion as well as the existence of negative values at low reddening indicate actual larger uncertainties. We thus conservatively estimated an error on E(B − V) of 0.03 in the linear regression discussed below. Figures 3 and 4 display the color excess as a function of the EW for the two DIBS.
We assumed that the DIB absorptions are sufficiently weak for us to be still in the linear regime, and that the DIB EW is on average proportional to the extinction. In establishing the correlations we used two methods, (i) a linear fit that does not take into account the measured individual error bars, but estimates errors on the parameters based on the observed data point dispersion, and (ii) a linear fit with the Orthogonal Distance Regression (ODR) method (also called total least-squares method) that takes into account the individual estimated errors on both the extinction values and the DIB EWs and minimizes the weighed orthogonal distance from the data to the fitted curve. We used the ODRPACK95 package (Boggs et al. 1989) implemented in the Wavemetrics/IGOR 6.0 software. Two noticeable facts can be derived from the figure: first, the data point dispersion for low values of E(B − V)s and EWs is higher than the EW uncertainties would suggest. We believe that the uncertainty on the color excess is partly, but only partly, responsible for this dispersion (see our discussion below). Second, there are conspicuous outliers in this plot, particularly a few data points that have a weak diffuse band while the color excess and the average fitted linear law imply a stronger one. It is known that such very low DIB strengths may exist (e.g. Porceddu et al. 1992). For both DIBS the fit coefficients from the two methods and the Pearson correlation coefficient (wich is independent of the error bars) are presented in Table 2. As can be seen in the table, the ODR-fitted parameters are very similar to the parameters that emerge in the absence of error bar weighting. For clarity, Figs. 3 and 4 show the ODR fit only. Also shown are the correlation parameters and coefficient obtained when excluding targets for which the departure from the mean relationship for E(B − V) is larger than 0.1 (rep 0.15) mag, which corresponds to one (resp. two) outliers for the 5780 (res. 6284) DIB. One of the outliers is ρOph, also excluded from the correlation by FR11. The second outlier is HD 179029, a B5V star that has peculiarly low DIB values (see the discussion below).
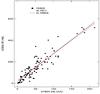 |
Fig. 5 Internal correlation between the two DIBs. Also shown is the DIB-DIB correlation found by FR11. |
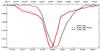 |
Fig. 6 Average DIB shapes derived from our FEROS spectra. For the 6284 DIB, we show a smoothed profile where the small-scale structures that remain after the averaging process were removed (see text). The three curves are available on-line from the CDS. |
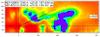 |
Fig. 7 Cut in a 3D opacity cube derived by inversion of color excess data (Vergely et al. 2010), in a vertical plane containing the Sun and the two stars HD 142805 and 142315. Distances are in parsecs. The Sun is at (0, 0) coordinates. The North Galactic Pole corresponds to the Y axis and the X axis is in the Plane toward the longitude 350 degrees. Violet represents the densest clouds, while red corresponds to the lowest density. A black line joining the Sun and the star allows one to appreciate the ISM distribution along the line-of-sight. Most of the intervening interstellar matter (violet) corresponds to dense clouds and there are no bright hot stars close to the LOS. This may be linked to their normal 5780 Å DIB strength. The black circles show the UV stars from the Hipparcos catalog and the circle diameter scales with their ionizing power. |
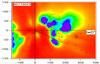 |
Fig. 8 Same as Fig. 5 for the outlier HD 179029. The path to the star corresponds to the boundary of a dense complex. A large part of the ISM along this LOS corresponds to the periphery of tenuous, presumably hot gas cavities and is not shielded from the ambient radiation field (the Local Cavity and a second cavity beyond 150 pc). |
We compared our results with the results of FR11 for these two bands, using their Table 1. The FR11 data points are superimposed on our FEROS determinations, and linear fits are similarly shown. Note that their data points, which correspond to the strongest EWs, i.e. largely above the FEROS measurements, are not visible in Figs. 3 and 4. Table 2 lists the fit parameters and Pearson correlation coefficient taken from Table 4 of FR11.
Our linear relationship coefficients are very close to those found by FR11 for the 5780 Å DIB, i.e., these two independent databases generally lead to the same dependence of the DIB with reddening. Because the two surveys do not correspond to the same hemisphere, this implies that there is no obvious dependence on the galactic direction, at least for the nearby (≤500 pc) ISM. There is a slightly larger difference between the FR11 coefficients and our numbers for the 6284 Å DIB. Data points with a low DIB and a high E(B − V) are more numerous in the FR11 dataset, which may influence the intercept value. While it is negligible in our case, it is found to be E(B − V) (at DIB = 0) = −0.02 for FR11. Comparing with the Vos et al. (2011) results on nearby ISM in Upper Scorpius, our average slope of 525 mA/E(B − V) for the 5780 Å DIB is slightly above their average slope of 460 mA/E(B − V).
For the 5780 Å DIB, the FEROS Pearson correlation coefficient of 0.92 appears significantly higher (see Table 2) than the coefficient found by FR11 (0.82). This difference becomes even larger if we limit the FR11 data to the same range of EWs as in our FEROS data, (i.e. EW ≤ 220 mÅ), which reduces the Pearson coefficient to 0.62 only. We have examined the potential reasons for this difference. First, it is not caused by the use of different sources for the color excess. We arrived at this conclusion after comparing of the E(B − V) quoted by FR11 and the corresponding Geneva determination for the 60 FR11 target stars that are included in the Geneva catalog. The dispersion around the linearity is one order of magnitude lower (at least) than the E(B − V) vs. EW dispersion. Second, we considered a potential effect of target location distribution in the sky. Figure 2 shows that there are no obvious differences in the way the targets are distributed, with both datasets possessing low- and high-latitude stars, and no conspicuous concentrations in specific regions, which makes this influence unlikely. This agrees with the similarity between the two mean relationships.
Our smaller dispersion can certainly not be caused by a better data quality or a more precise EW computation. The contrary is demonstrated by the comparison between the internal correlation coefficients derived from the two datasets. The correlation between the FEROS 5780 and 6284 DIBS equivalent widths is shown in Fig. 5. Our 5780 vs. 6284 Pearson correlation coefficient is 0.91, i.e., inferior to the 0.96 correlation coefficient derived by FR11, which implies the absence of an additional dispersion due to their EW derivation. We believe that our higher dispersion for the DIB-DIB correlation is due to the superior resolution and signal-to-noise of the FR11 data, and to the fact that our EWs are smaller. Indeed, the 6284 − 5780 coefficient of FR11 decreases from 0.96 down to 0.86 when restricting the DIB-DIB correlation to 5780 Å EWs smaller than 22 mÅ. We also note some small differences on the internal correlations. Our average linear relationship is found to be
 which denotes a bias toward a lowest 6284 threshold. These numbers are different from the results of FR11: a = 28.2 ± 5.8 and b = 2.32 ± 0.03. Imposing the same intercept of 28.2, we derive b = 2.48 ± 0.08, which is already much closer to their relationship, and suggests that there are indeed biases toward positive intercepts linked to some outliers with low 5780 Å DIBS.
We then investigated the effect of the target distances. Our targets are nearby stars, 80% are located within 400 pc and only 3 stars lie between 650 and 1150 pc (Hipparcos parallaxes). The FR11 targets are on average more distant, with only 50% of targets within 400 pc and ≃ 50 stars beyond 650 pc. In principle, the dispersion should decrease with distance, because cloud-to-cloud variations are averaged. However, to improve the comparison between our datasets, we fitted a linear relationship between the FR11 reddening values and their 5780.4 EWs for a restricted set of targets closer than 400 pc. In the same way that the coefficient decreases with the EW threshold, it also decreases by introducing such a threshold on the distance (0.62 Pearson coefficient instead of 0.82). This implies that the reason for a tighter correlation in our dataset is not linked to the choice of closer targets.
We finally considered the stellar characteristics in both samples: here there is a marked difference that is a direct consequence of the difference between the goals of the two surveys. Figure 1 shows the distribution of stellar types. While FR11 mostly used very bright and hot stars (mostly earlier than B5) to obtain spectra of extremely high quality, the present sample is mainly composed of moderately hot stars, with a maximum around B7, chosen for their location in direction and distance, and does not contain bright blue stars because such stars, being easy targets, have already been observed in the past with other instruments. Moreover, about half of the FR11 targets are giants or subgiants (class I to III), while our targets are mainly dwarfs (≃20% of class I−III). Given this difference, our interpretation is the following: owing to the effect of the UV radiation field on the two DIBs, and according to recent findings (e.g. Vos et al. 2011), there is a strong variability of their concentration or of their charge state around the hot blue stars that are part of the FR11 study. For nearby stars, the fraction of the matter along the path length that is influenced by the hot target star may be large, e.g. if the densest cloud along the sightline is close to it (or is engulfing the target). For this reason, the total DIB absorption strongly reflects this environment, hence the variability of the DIB to dust ratio. For a set of moderately hot target stars, this effect is not so much pronounced and the line-of-sight to line-of-sight variability is not as high. This explains our tighter correlation and the correlation strength increase with distance for the FR11 dataset. It is evidently linked also to the larger number of “outliers” in the FR 11 data that are discussed and thought to be linked to high-radiation environments.
6. Perspectives
Our study and the performed comparisons shed additional light on the correlation between the 5780 Å and 6284 Å DIBs and the reddening, as well as on the influence of the stellar radiation field on those DIBs. The fact that average relationships are similar for the two hemispheres shows that those relationships do not vary much with location. The diminution of the dispersion when using late-type targets, especially for the 5780 Å DIB, is useful in the sense that it helps in approaching the most appropriate average coefficients to use for conversion purposes, if necessary. Our best-fit scaling for the 5780 Å DIB corresponds to 525 mA/E(B − V). It is very close to an average of the two 419 and 640 mA/E(B − V) coefficients found by Vos et al. (2011) for the Upper Scorpius σ-type (or external ionized regions) and ζ-type (shielded cloud cores) sightlines, respectively.
We used the then strongest and cleanest measured DIBs, normalized them, scaled them to the same equivalent width and averaged them to provide their most precise shapes for use at resolutions lower than 50 000. The results are shown in Fig. 6. For the 6284 Å DIB there are irregularities that remain despite the averaging process. We believe they are caused by imperfections of the telluric line removal procedure, but it is difficult to preclude some substructures of the DIB itself. We provide both the raw shape and a smoothed version where those substructures have been removed. The 5780 Å DIB corresponds to an EW of 217 mÅ (E(B − V) ≃ 0.41 with the average relationship) while the 6284 Å DIB corresponds to EW = 500 mÅ and E(B − V) ≃ 0.32.
More studies at larger distance will allow one to investigate the evolution of the DIB-extinction relationship, and better constrain the DIB sites. In this respect, the building of 3D maps of galactic dust or gas based on extinction and absorption data will allow progress in characterizing the DIB production sites. Figures 5 and 6 show cuts in a 3D opacity distribution inverted from extinction measurements in the solar neighborhood (Tarantola & Valette 1982; Vergely et al. 2010) that contain sightlines with average or peculiar DIB to extinction ratios. The one to the outlier HD 179029 is tangential to a nearby cavity presumably blown by stellar winds or supernovae, and does not cross any large dense cloud association. The two normal sightlines toward HD 142805 and HD 142315 both cross an extended high-density area, devoid of very bright early-type stars. These maps have a low spatial resolution of about 15 pc, which is a strongly limiting factor for any study of the line-of-sight characterization. In future, studying with more detailed maps the relationships between the DIB to reddening ratios as a function of such sightline characteristics will hopefully provide additional clues to the DIB formation sites.
Online material
Stellar data and measurements.
Acknowledgments
We deeply thank Lucky Puspitarini, who coded the sliding windows method for equivalent width error estimates and applied it to all spectra.
References
- Boggs, P. T., Byrd, R. H., Donaldson, J. R., & Schnabel, R. B. 1989, ODRPACK, ACM Trans. Mathematical Software, 15, 348 [CrossRef] [Google Scholar]
- Cami, J., Sonnentrucker, P., Ehrenfreund, P., & Foing, B. H. 1997, A&A, 326, 822 [NASA ADS] [Google Scholar]
- Clough, S. A., Shephard, M. W., Mlawer, E. J., et al. 2005, Atmospheric radiative transfer modeling: a summary of the AER codes, Short Communication, J. Quant. Spectrosc. Radiat. Transf., 91, 233 [Google Scholar]
- Cox, N. L. J., Cordiner, M. A., Cami, J., et al. 2006, A&A, 447, 991 [NASA ADS] [CrossRef] [EDP Sciences] [Google Scholar]
- Cox, N. L. J., Ehrenfreund, P., Foing, B. H., et al. 2011, A&A, 531, A25 [NASA ADS] [CrossRef] [EDP Sciences] [Google Scholar]
- Cramer, N. 1999, New Astron. Rev., 43, 343 [NASA ADS] [CrossRef] [Google Scholar]
- Friedman, S. D., York, D. G., McCall, B. J., et al. 2011, ApJ, 727, 33 (FR11) [NASA ADS] [CrossRef] [Google Scholar]
- Fulara, J., & Krelowski, J. 2000, New A Rev., 44, 581 [Google Scholar]
- Galazutdinov, G. A., Manicò, G., Pirronello, V., & Krełowski, J. 2004, MNRAS, 355, 169 [NASA ADS] [CrossRef] [Google Scholar]
- Herbig, G. H. 1995, ARA&A, 33, 19 [NASA ADS] [CrossRef] [Google Scholar]
- Hobbs, L. M., York, D. G., Snow, T. P., et al. 2008, ApJ, 680, 1256 [NASA ADS] [CrossRef] [Google Scholar]
- Hobbs, L. M., York, D. G., Thorburn, J. A., et al. 2009, ApJ, 705, 32 [NASA ADS] [CrossRef] [Google Scholar]
- Jenniskens, P., & Desert, F.-X. 1994, A&AS, 106, 39 [NASA ADS] [Google Scholar]
- Krelowski, J., & Sneden, C. 1994, The First Symposium on the Infrared Cirrus and Diffuse Interstellar Clouds, 58, 12 [NASA ADS] [Google Scholar]
- Krelowski, J., & Walker, G. A. H. 1987, ApJ, 312, 860 [NASA ADS] [CrossRef] [Google Scholar]
- Krelowski, J., Schmidt, M., & Snow, T. P. 1997, PASP, 109, 1135 [NASA ADS] [CrossRef] [Google Scholar]
- Leger, A., & D’Hendecourt, L. 1985, A&A, 146, 81 [Google Scholar]
- McCall, B. J., Drosback, M. M., Thorburn, J. A., et al. 2010, ApJ, 708, 1628 [NASA ADS] [CrossRef] [Google Scholar]
- Perryman, M. A. C., Lindegren, L., Kovalevsky, J., et al. 1997, A&A, 323, L49 [NASA ADS] [Google Scholar]
- Porceddu, I., Benvenuti, P., & Krelowski, J. 1992, A&A, 260, 391 [NASA ADS] [Google Scholar]
- Rothman, L. S., Gordon, I. E., Barbe, A., et al. 2009, J. Quant. Spec. Radiat. Transf., 110, 533 [Google Scholar]
- Salama, F., Bakes, E. L. O., Allamandola, L. J., & Tielens, A. G. G. M. 1996, ApJ, 458, 621 [NASA ADS] [CrossRef] [PubMed] [Google Scholar]
- Sarre, P. J. 2006, J. Mol. Spectr., 238, 1 [NASA ADS] [CrossRef] [Google Scholar]
- Smith, W. H., Snow, T. P., Jr., & York, D. G. 1977, ApJ, 218, 124 [NASA ADS] [CrossRef] [Google Scholar]
- Snow, T. P., & Destree, J. D. 2011, EAS Publ. Ser., 46, 341 [Google Scholar]
- Tarantola, A., & Valette, B. 1982a, J. Geophys., 50, 159 [Google Scholar]
- Thorburn, J. A., Hobbs, L. M., McCall, B. J., et al. 2003, ApJ, 584, 339 [NASA ADS] [CrossRef] [Google Scholar]
- van Leeuwen, F. 2007, A&A, 474, 653 [NASA ADS] [CrossRef] [EDP Sciences] [Google Scholar]
- Vergely, J.-L., Freire Ferrero, R., Siebert, A., & Valette, B. 2001, A&A, 366, 1016 [NASA ADS] [CrossRef] [EDP Sciences] [Google Scholar]
- Vergely, J.-L., Valette, B., Lallement, R., & Raimond, S. 2010, A&A, 518, A31 [NASA ADS] [CrossRef] [EDP Sciences] [Google Scholar]
- Vos, D. A. I., Cox, N. L. J., Kaper, L., Spaans, M., & Ehrenfreund, P. 2011, A&A, 533, A129 [NASA ADS] [CrossRef] [EDP Sciences] [Google Scholar]
- Welsh, B. Y., Lallement, R., Vergely, J.-L., & Raimond, S. 2010, A&A, 510, A54 [NASA ADS] [CrossRef] [EDP Sciences] [Google Scholar]
- Welty, D. E., Federman, S. R., Gredel, R., Thorburn, J. A., & Lambert, D. L. 2006, ApJS, 165, 138 [NASA ADS] [CrossRef] [Google Scholar]
All Tables
All Figures
|
Fig. 1 Location of our FEROS targets (red circles), and comparison with the FR11 survey targets (black crosses). Also shown are the distributions of stellar types (bottom). |
| In the text | |
|
Fig. 2 Illustrations of the DIB equivalent width measurements. The top (bottom) graphs show the spectra before (after) normalization, i.e., division by the fitted continuum. The hatched areas correspond to the measured equivalent widths. (Left) A typical continuum fitting and EW extraction of the 5780 Å DIB. (Middle) Example of removing contaminating stellar lines for the late-B target stars. (Right) Example of telluric line removal by means of a synthetic transmission for the 6284 Å DIB and the subsequent EW measurement. |
| In the text | |
|
Fig. 3 Johnson color excess as a function of the 5780 Å DIB equivalent width for our FEROS stars (black filled circles). Also shown are the results of FR11 (red plus signs) for equivalent widths lower than 230 mÅ. Stars beyond 400 parsecs are indicated by small markers. Dashed and solid lines are the linear correlations for the FR11 et FEROS data. The FEROS correlation corresponds to the ODR method and all data. The FR11 correlation is for case (3) of Table 2. |
| In the text | |
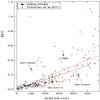 |
Fig. 4 Same as Fig. 3 for the 6284 DIB. |
| In the text | |
|
Fig. 5 Internal correlation between the two DIBs. Also shown is the DIB-DIB correlation found by FR11. |
| In the text | |
|
Fig. 6 Average DIB shapes derived from our FEROS spectra. For the 6284 DIB, we show a smoothed profile where the small-scale structures that remain after the averaging process were removed (see text). The three curves are available on-line from the CDS. |
| In the text | |
|
Fig. 7 Cut in a 3D opacity cube derived by inversion of color excess data (Vergely et al. 2010), in a vertical plane containing the Sun and the two stars HD 142805 and 142315. Distances are in parsecs. The Sun is at (0, 0) coordinates. The North Galactic Pole corresponds to the Y axis and the X axis is in the Plane toward the longitude 350 degrees. Violet represents the densest clouds, while red corresponds to the lowest density. A black line joining the Sun and the star allows one to appreciate the ISM distribution along the line-of-sight. Most of the intervening interstellar matter (violet) corresponds to dense clouds and there are no bright hot stars close to the LOS. This may be linked to their normal 5780 Å DIB strength. The black circles show the UV stars from the Hipparcos catalog and the circle diameter scales with their ionizing power. |
| In the text | |
|
Fig. 8 Same as Fig. 5 for the outlier HD 179029. The path to the star corresponds to the boundary of a dense complex. A large part of the ISM along this LOS corresponds to the periphery of tenuous, presumably hot gas cavities and is not shielded from the ambient radiation field (the Local Cavity and a second cavity beyond 150 pc). |
| In the text | |
Current usage metrics show cumulative count of Article Views (full-text article views including HTML views, PDF and ePub downloads, according to the available data) and Abstracts Views on Vision4Press platform.
Data correspond to usage on the plateform after 2015. The current usage metrics is available 48-96 hours after online publication and is updated daily on week days.
Initial download of the metrics may take a while.