Fig. 3
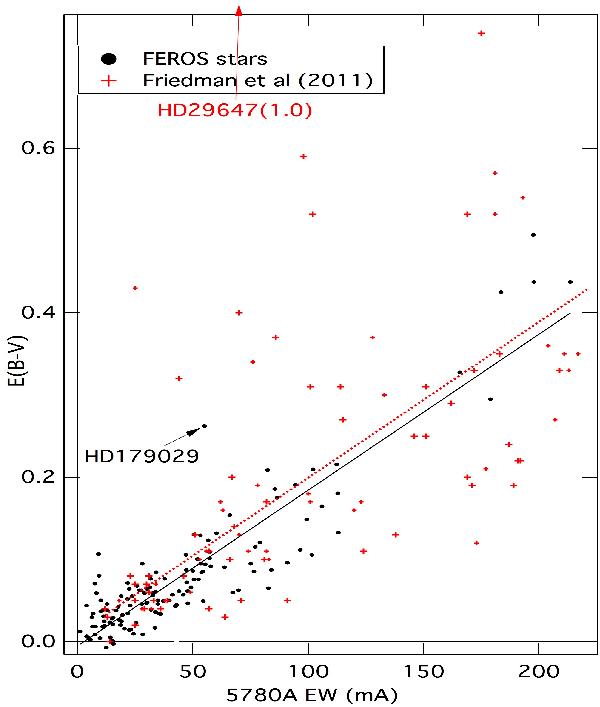
Johnson color excess as a function of the 5780 Å DIB equivalent width for our FEROS stars (black filled circles). Also shown are the results of FR11 (red plus signs) for equivalent widths lower than 230 mÅ. Stars beyond 400 parsecs are indicated by small markers. Dashed and solid lines are the linear correlations for the FR11 et FEROS data. The FEROS correlation corresponds to the ODR method and all data. The FR11 correlation is for case (3) of Table 2.
Current usage metrics show cumulative count of Article Views (full-text article views including HTML views, PDF and ePub downloads, according to the available data) and Abstracts Views on Vision4Press platform.
Data correspond to usage on the plateform after 2015. The current usage metrics is available 48-96 hours after online publication and is updated daily on week days.
Initial download of the metrics may take a while.