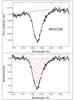
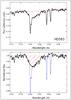
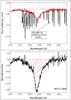
Fig. 2
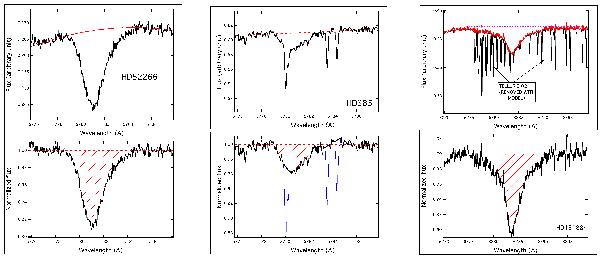
Illustrations of the DIB equivalent width measurements. The top (bottom) graphs show the spectra before (after) normalization, i.e., division by the fitted continuum. The hatched areas correspond to the measured equivalent widths. (Left) A typical continuum fitting and EW extraction of the 5780 Å DIB. (Middle) Example of removing contaminating stellar lines for the late-B target stars. (Right) Example of telluric line removal by means of a synthetic transmission for the 6284 Å DIB and the subsequent EW measurement.
Current usage metrics show cumulative count of Article Views (full-text article views including HTML views, PDF and ePub downloads, according to the available data) and Abstracts Views on Vision4Press platform.
Data correspond to usage on the plateform after 2015. The current usage metrics is available 48-96 hours after online publication and is updated daily on week days.
Initial download of the metrics may take a while.