Fig. 10
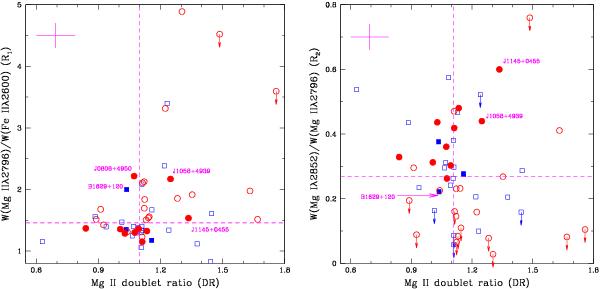
R1 and R2 vs. DR are plotted for the systems towards quasars with the VLBA images. Dashed lines in the panels are for median values of DR = 1.1, R1 = 1.47 and R2 = 0.27. Systems at 0.5 < z < 1 are plotted as squares and 1.1 < z < 1.5 as circles. Filled symbols are for 21-cm detections. Values for system towards J0808+4950 (G09), J1058+4939 (G09), J1145+0455 (Table C.1) and B1629+120 (Lane 2000) are labelled. Median error bars are shown at the top-left corner. System towards J2129 − 1538 is omitted due to large uncertainties on equivalent widths.
Current usage metrics show cumulative count of Article Views (full-text article views including HTML views, PDF and ePub downloads, according to the available data) and Abstracts Views on Vision4Press platform.
Data correspond to usage on the plateform after 2015. The current usage metrics is available 48-96 hours after online publication and is updated daily on week days.
Initial download of the metrics may take a while.