| Issue |
A&A
Volume 544, August 2012
|
|
|---|---|---|
| Article Number | A21 | |
| Number of page(s) | 25 | |
| Section | Extragalactic astronomy | |
| DOI | https://doi.org/10.1051/0004-6361/201219159 | |
| Published online | 19 July 2012 | |
Online material
Results from the VLBA data.
Appendix A: Log of the 21-cm absorption observations
Log for the GBT, GMRT and WSRT observations.
Appendix B: Determining flux densities and 21-cm optical depths
Summary of our 21-cm absorption measurements.
For the quasars observed with the GBT8 the rms confusion due to other radio sources in the beam can be the dominant effect that limits the accuracy with which flux density of the background quasar and therefore the 21-cm optical depth can be determined. We use interferometric images from our WSRT observations and literature to address this issue. First consider the two quasars with 21-cm absorption detections from the GBT data. For J1252+4427, in the FIRST catalogue, there are no strong
(≳10 mJy) sources within 15′ and the total flux density due to other sources within the beam FWHM is only ~20 mJy. This suggests that the confusion is not a serious issue for this quasar, and indeed the flux density estimated from our GBT observations matches within ~5% with the estimate from the interpolation of flux densities from the FIRST (at 20-cm) and WENSS (at 92-cm) surveys. The other quasar with 21-cm detection i.e. J0457−2324 is a blazar and known to exhibit variability (see Sect. 2.2). We measure the flux density of 2.72 Jy from our GBT observations. The contribution due to other sources within the beam FWHM at 20-cm based on the NVSS is 384 mJy (no beam-correction). The 90% of contribution comes from a source that has a steep spectral index of 0.9. Assuming that this other source is not variable would imply that the flux density of J0457−2324 is 2.4 Jy (beam correction applied) at the redshifted 21-cm absorption frequency.
Now consider systems towards the quasars with no 21-cm detections from the GBT. The flux density estimates for J1007+2251, J1216+5843 and J1329+1053 at the redshifted 21-cm frequency are estimated from our WSRT observations which took place within 6 months of the GBT observations (Table A.1). For J1148+5254 and J1410+6141, the flux densities at the redshifted 21-cm frequency have been estimated by interpolating between the flux densities from the FIRST and WENSS surveys at 20-cm and 92-cm respectively. The flux densities for J1333+1649 and J1636+2112 have been determined using the FIRST and TXS surveys. Table B.1 lists the flux densities and optical depth values for all the Mg ii systems observed.
Appendix C: Strong Mg II systems selected from Kanekar et al. (2009)
Details of the strong Mg ii systems (Wr ≥ 1 Å) and 21-cm absorption measurements taken from Kanekar et al. (2009).
Appendix D: Strong Mg II systems selected from Lane (2000)
The Table 6 of G09 lists strong Mg ii systems with 21-cm measurements from Lane (2000). Only systems at zabs > 0.5 are considered here (see Sect. 2.3). The systems towards B0109+176 and B0957+003 are common with the sample of Kanekar et al. (2009) and are listed in Table C.1 with the more sensitive optical depth limits. In addition to the absorber towards B1622+238, we have excluded the system towards the quasar B0827+243 as it is non-Mg ii selected (see Lane 2000, for the details).
Sample of Mg ii systems with Wr ≥ 1 Å from Lane (2000). The column listings are same as in Table C.1.
Appendix E: 20-cm VLBA maps of quasars from our sample
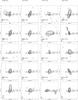 |
Fig. E.1
Contour plots of the VLBA images at 20-cm. The rms in the images are listed in Table 4 and the maps are centred at the Gaussian “component-1” fitted to characterise the milliarcsecond scale structure. The restoring beam, shown as the ellipse, and the first contour level (CL) in mJy beam-1 are provided at the bottom of each image. The contour levels are plotted as CL × ( − 1, 1, 2, 4, 8, ...) mJy beam-1. |
| Open with DEXTER | |
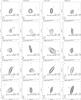 |
Fig. E.1
continued. |
| Open with DEXTER | |
© ESO, 2012
Current usage metrics show cumulative count of Article Views (full-text article views including HTML views, PDF and ePub downloads, according to the available data) and Abstracts Views on Vision4Press platform.
Data correspond to usage on the plateform after 2015. The current usage metrics is available 48-96 hours after online publication and is updated daily on week days.
Initial download of the metrics may take a while.