Fig. 5
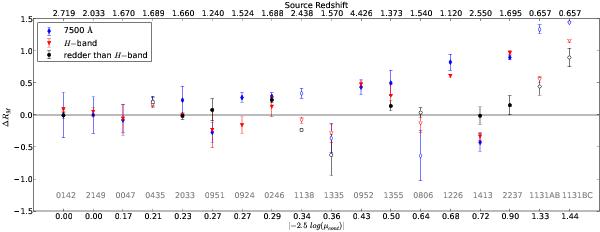
Pseudo color ΔRM = −2.5 log (Mw/M), where M is the intrinsic flux ratio derived from our spectra using the MmD and Mw is the flux ratio measured in 3 different wavelength ranges: (1) the region around 7500 Å (blue diamonds), (2) the H-band (red triangles), and (3) wavelengths redder than H-band (black circle). Open symbols are used for the systems where our spectroscopic estimate of M disagrees with the value at wavelengths redder than H-band (see Sect. 4.4). The objects are ordered from left to right as a function of increasing microlensing of the continuum (note that the steps are not linear). The gray labels provide the name of the systems (shortened to the first 4 digits of the RA) and the upper axis indicates the redshift of the source.
Current usage metrics show cumulative count of Article Views (full-text article views including HTML views, PDF and ePub downloads, according to the available data) and Abstracts Views on Vision4Press platform.
Data correspond to usage on the plateform after 2015. The current usage metrics is available 48-96 hours after online publication and is updated daily on week days.
Initial download of the metrics may take a while.