Fig. 1
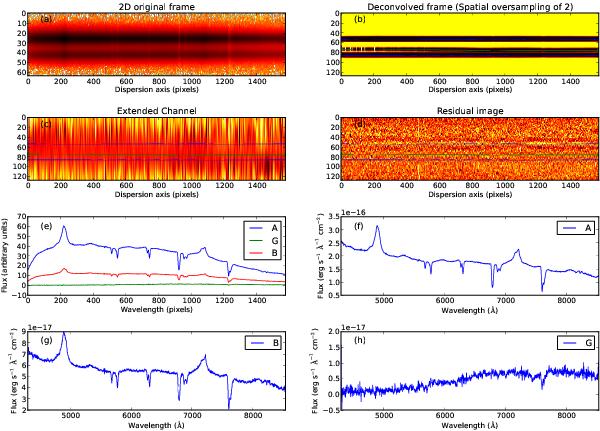
Example of deconvolution for SDSS J1335+0118. The first two lines show the original frame a) and its deconvolved version spatially oversampled by a factor 2 b), the deconvolved flux which is not PSF-like c) and the residual frame d) with upper/lower cuts at ± 3σ. The location of the centroid of the deconvolved PSFs is indicated with solid lines in panels b–d). Panel e) shows the extracted spectra of the lensed QSO images and of the lensing galaxy derived from the deconvolution. The last three panels f–h) show the calibrated spectra of these components following the procedure explained in Sect. 2.2. This figure is available for all the other systems on CDS.
Current usage metrics show cumulative count of Article Views (full-text article views including HTML views, PDF and ePub downloads, according to the available data) and Abstracts Views on Vision4Press platform.
Data correspond to usage on the plateform after 2015. The current usage metrics is available 48-96 hours after online publication and is updated daily on week days.
Initial download of the metrics may take a while.