| Issue |
A&A
Volume 544, August 2012
|
|
|---|---|---|
| Article Number | A121 | |
| Number of page(s) | 6 | |
| Section | Cosmology (including clusters of galaxies) | |
| DOI | https://doi.org/10.1051/0004-6361/201118757 | |
| Published online | 10 August 2012 | |
Asymmetries in the angular distribution of the cosmic microwave background
1 Università di Roma “Tor Vergata”Dipartimento di Fisica, Roma, Italy
e-mail: This email address is being protected from spambots. You need JavaScript enabled to view it.
2 Instituto Nacional de Pesquisas Espaciais – INPE, Divisão de Astrofísica, São José dos Campos, SP, Brazil
Received: 28 December 2011
Accepted: 22 June 2012
Abstract
Context. Intriguing features in the angular distribution of the cosmic microwave background (CMB), such as the north-south asymmetry, were reported in the one- and three-year Wilkinson Microwave Anisotropy Probe (WMAP) data and should be studied in detail. We investigate some of these asymmetries in the CMB temperature angular distribution considering the ΛCDM model in the three, five, and seven year WMAP data.
Aims. We aim to analyze the four quadrants of the internal linear combination (ILC) CMB maps using three different Galactic cuts: the WMAP KQ85 mask, a |b| < 10° Galactic cut, and the WMAP KQ85 mask + |b| < 10° Galactic cut.
Methods. We used the two-point angular correlation function (TPCF) in the WMAP maps for each of their quadrants. The same procedure was performed for 1000 Monte Carlo (MC) simulations that were produced using the WMAP team ΛCDM best-fit power spectrum. In addition, we changed the quadrupole and octopole amplitudes obtained from the ΛCDM model spectrum. We changed this to fit the quadrupole and octopole amplitudes to their observable values from the WMAP data. We repeated the analysis for the 1000 simulations of this modified ΛCDM model, hereafter MΛCDM.
Results. Our analysis showed asymmetries between the southeastern quadrant (SEQ) and the other quadrants (southwestern quadrant (SWQ), northeastern quadrant (NEQ) and northwestern quadrant (NWQ)). Over all WMAP ILC maps, the probability for the occurrence of the SEQ-NEQ, SEQ-SWQ and SEQ-NWQ asymmetries varies from 0.1% (SEQ-NEQ) to 8.5% (SEQ-SWQ) using the KQ85 mask and the KQ85 mask + |b| < 10° Galactic cut, respectively. We also calculated the probabilities for the MΛCDM using only the KQ85 mask and found no significant differences in the results. Moreover, the cold spot region located in the SEQ quadrant was covered with masks of 5, 10 and 15 degrees radius and again the results remained unchanged. Furthermore, this analysis was repeated for random regions in the SEQ quadrant with a 15-degree mask and the SEQ quadrant still remained asymmetric with respect to the other quadrants of the CMB map.
Conclusions. We found an excess of power in the TPCF at scales >100 degrees in the SEQ with respect to the other quadrants that is independent of the Galactic cut used. Moreover, we tested a possible relation between the cold spot and the SEQ excess of power and found no evidence for it. Finally, we could not find any specific region within the SEQ that might be considered responsible for the quadrant asymmetry.
Key words: cosmic background radiation / cosmology: observations / methods: data analysis / methods: statistical
© ESO, 2012
1. Introduction
After the cosmic microwave background (CMB) discovery by Penzias & Wilson (1965), several experiments were developed to characterize this radiation, leading to high-precision observations that raised the status of the CMB, which is since considered to be one of the main pillars of the ΛCDM model. Particularly, the CMB cosmological fluctuations first detected by the COsmic Background Explorer (COBE) satellite data (Smoot et al. 1992) set up a new era in cosmology studies and paved the way to what today is called precision cosmology. However, detailed studies of the angular distribution of temperature fluctuations showed unexpected results if analyzed within the framework of the so-called cosmological concordance model (ΛCDM model). These peculiar features in the CMB angular distribution were found for the first time in the COBE data and attracted much interest since then.
A quadrupole amplitude smaller than that expected according to the ΛCDM model was reported by the COBE team (Smoot et al. 1992) and was confirmed by all WMAP data releases (Bennett et al. 2003; Hinshaw et al. 2007, 2009; Jarosik et al. 2011). Other anomalies were found in the WMAP data that were not expected according to the ΛCDM model either, such as the alignment between the quadrupole and octopole (e.g. Bielewicz et al. 2004; Schwarz et al. 2004; Copi et al. 2004; de Oliveira-Costa et al. 2004; Bielewicz et al. 2005; Land & Magueijo 2005; Copi et al. 2006; Abramo et al. 2006; Frommert & Ensslin 2010; Gruppuso & Burigana 2010), the low quadrupole and octopole amplitudes (e.g., Mukherjee & Wang 2003; Ayata et al. 2010; Cayon 2010; Cruz et al. 2011), the north-south asymmetry (e.g., Eriksen et al. 2004a; Hansen et al. 2004a; Eriksen et al. 2004b; Hansen et al. 2004b; Donoghue et al. 2005; Hoftuft et al. 2009; Paci et al. 2010; Pietrobon et al. 2010; Vielva & Sanz 2010), the anomalous alignment of the CMB features toward the Ecliptic poles (e.g., Wiaux et al. 2006; Vielva et al. 2007), and the cold spot (e.g., Vielva et al. 2004; Cruz et al. 2005, 2007; Vielva 2010).
Recently, Aluri & Jain (2012) analyzed in detail the signature of parity asymmetry first found by Kim & Naselsky (2010) in the WMAP best-fit temperature power spectrum, confirming this asymmetry on a 3-σ level. Aluri & Jain (2012) also concluded that their result is not due to residual foregrounds or to foreground cleaning. In addition, the preferred direction of the parity asymmetry coincides with the CMB kinematic dipole, showing that it may somehow be related to the quadrupole-octopole alignment (Naselsky et al. 2012).
On the other hand, Bennett et al. (2011) reviewed the anomalies reported in the CMB temperature fluctuations and claimed that they are not statistically significant and, for this reason, do not in disagree with the ΛCDM concordance model.
Nevertheless, in this work we report an asymmetry in the WMAP temperature anisotropy data appearing in the two-point angular correlation function (TPCF) at scales above 100 degrees. In Sect. 2 we present our method to prepare the MC sky map simulations to confront them with real data and describe our TPCF method. In Sect. 3 we show our results. Finally, in Sect. 4 we present the discussion, followed by the conclusions in Sect. 5.
2. Method
The results presented in this paper were derived from the analysis of three temperature ILC maps from the third, fifth and seventh year of WMAP data: WILC3 (Hinshaw et al. 2007), WILC5 (Gold et al. 2008) and WILC7 (Jarosik et al. 2011). We computed the TPCF for the WMAP data and for the MC simulations to obtain, evaluate and finally compare the results with the ΛCDM model. The HEALPix (hierarchical equal area and isolatitude pixelization) package (synfast) (Gorski et al. 2005) was used to generate the MC simulations and analyze the maps.
The simulated sky maps were generated with two different seed spectra. In the first run, we used the WMAP5 best-fit spectrum to the ΛCDM model, available at LAMBDA1, to generate 1000 simulations with Nside = 256 (pixel diameter ~14′). In the second run, we modified the ΛCDM model spectrum, substituting the amplitudes of the best-fit quadrupole and octopole by the values reported in the WMAP five-year data. This modified spectrum was used to generate 1000 simulations with the same resolution as the first run (the MΛCDM model).
The data and the simulations were analyzed by means of the TPCF. Since it is hard to analyze the CMB angular distribution because of the foreground contamination, even using multifrequency maps, we chose to use three different Galactic cuts. When the first CMB maps covering the whole sky were released from the Relict satellite (Strukov & Skulachev 1984), the safest way to deal with the foreground contamination was making parallel cuts above and below the Galactic plane. More recently, the masks developed by the WMAP team remove in a fair way the known point sources and the Galactic signal, but they are not perfect since the Galactic foregrounds are still not completely known. Smoot et al. (1992) also warned that the TPCF is highly affected when regions | b | < 10° are included in the analyses. Taking into account these results, we used the WMAP KQ85 mask, a Galactic cut | b | < 10° and the WMAP KQ85 mask + | b | < 10° Galactic cut in the present work. This last cut avoids the Galactic foreground and also the known point sources. All calculations were performed for degraded maps with Nside = 64. We analyzed the NWQ with 9906, 10 200 and 9495 pixels for each Galactic cut. For the SWQ, 10 423, 10 200 and 9795 pixels were used, for the NEQ, 10 250, 10 176 and 9417 pixels were used, and for the SEQ 9854, 10 176, 9350 pixels were used, when the Galactic foreground was removed with the WMAP KQ85 mask, the Galactic cut | b | < 10°, and the WMAP KQ85 mask + | b | < 10° Galactic cut, respectively. We also counted the pixels left in each quadrant when the new WMAP mask KQ85y7 was used to remove the Galactic foregorund, there were 9571 pixels in the NWQ, 10 093 pixels in the SWQ, 9876 pixels in the NEQ, and 9217 pixels in the SEQ.
The influence of the KQ85 mask asymmetry on the results was evaluated considering the three Galactic cuts. The same procedure was applied to the ΛCDM simulated sky maps. The MΛCDM realizations were analyzed using only the WMAP KQ85 mask. This modified spectrum enabled us to evaluate if the observed low quadrupole and octopole values can account for the results. We did not repeat the analysis using the KQ85y7 mask for the MC simulations because of the very large computational time required for computing the TPCF, with no clear gain of knowledge about the problem.
2.1. Two-point angular correlation function
The TPCF function measures the angular correlation of temperature fluctuations distributed in the sky and is defined as  (1)T(np) and T(nq) are the temperature fluctuations of the p and q pixels, respectively, and γ is the angular distance between the two pixels.
The pixels p and q are defined by the coordinates (θp, φp) and (θq, φq), where 0° ≤ φ ≤ 360° and − 90° ≤ θ ≤ 90°. It is now possible to obtain the equation for γ:  (2)Finally, we define an rms-like quantity, σ, to compare the TPCF computed both for WMAP data and MC simulations (Bernui et al. 2006):
  (3)The fi corresponds to the TPCF for each bin i. We used the number of bins Nbins = 90 to quantify our results.
3. Results
As mentioned before, we divided the CMB sky into quadrants and computed the TPCF for each quadrant, using the three different Galactic cuts: the WMAP KQ85 mask, the Galactic cut | b | < 10° and the WMAP KQ85 mask + | b | < 10° Galactic cut. The results are shown in Figs. 1 to 6. Asymmetries between the SEQ and the other quadrants can be easily noticed in the curves. On the other hand, the TPCF curves for the NWQ, the NEQ and the SWQ are mostly inside the gray-shadowed area, which corresponds to the MC 1σ interval.
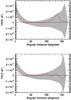 |
Fig. 1 TPCF curves computed for the WILC7 map using the WMAP KQ85 mask, smoothed for illustration purposes. The NWQ (top) and the NEQ (bottom) appear as solid red lines. The shadow part depicts the standard deviation intervals for 1000 simulated maps produced with the ΛCDM spectrum. |
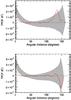 |
Fig. 3 Same as Fig. 1, but now using the WMAP KQ85 mask + | b | < 10° Galactic cut in the temperature WMAP7 data. From top to bottom, the curves refer to the NWQ and the NEQ, respectively. |
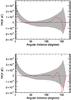 |
Fig. 5 Same as Figs. 1 − 4, but now using | b | < 10° Galactic cut, again in the temperature WILC7 map. From top to bottom the curves refer to the NWQ and the NEQ, respectively. |
Tables 1 − 3 show the probability for these asymmetries to occur for the ILC maps, and for the MC maps derived from the ΛCDM model. Both consider the above mentioned Galactic cuts.
Calculated probabilities of finding the same asymmetries as in WMAP data in the MC simulations using the WMAP KQ85 mask and considering the ΛCDM model.
Calculated probabilities of finding the same asymmetries as in WMAP data in the MC simulations using the WMAP KQ85 mask + | b | < 10° Galactic cut and considering the ΛCDM model.
Calculated probabilities of finding the same asymmetries as in WMAP data in the MC simulations using the | b | < 10° Galactic cut and considering the ΛCDM model.
These tables also contain two sets of probabilities, P1 and P2. The probability P1 refers to the chance that exactly the same asymmetries found in the WMAP sky maps appear in the MC simulations:
-
σSEQ/σNWQ(simul.) ≥ σSEQ/σNWQ(data)
-
σSEQ/σSWQ(simul.) ≥ σSEQ/σSWQ(data)
-
σSEQ/σNEQ(simul.) ≥ σSEQ/σNEQ(data).
The probability P2 extends the range of P1, comparing the chance that the ratio between the asymmetries found in the SEQ and in any of the three quadrants (from the MC simulations) to exceed that from the ratio between the SEQ and one given quadrant. The ** in the expressions below apply for any of the three quadrants ( ∗ ∗ = NW or SW or NE).
-
σSEQ/σ ∗ ∗ Q(simul.) ≥ σSEQ/σNWQ(data)
-
σSEQ/σ ∗ ∗ Q(simul.) ≥ σSEQ/σSWQ(data)
-
σSEQ/σ ∗ ∗ Q(simul.) ≥ σSEQ/σNEQ(data).
3.1. The cold spot
Because the asymmetry was coincidentally found in the same quadrant as the so-called cold spot (see Cruz et al. 2007; Vielva & Sanz 2010), we tested if they are possibly correlated. We masked the cold spot region which is centered on φ = 209° and θ = 141°, and calculated the TPCF for the SEQ using also the KQ85 mask. The cold spot mask radii were 5°, 10° and 15°.
Finally, to look for a specific region in the SEQ that could account for the asymmetry, we scanned this quadrant, masking four different regions in addition to the cold spot region. The masks were centered on coordinates chosen randomly on (φ = 315°, θ = 157°), (φ = 225°,θ = 113°), (φ = 270°,θ = 135°), (φ = 315°,θ = 113°), all of them with a radius of 15°. The TPCF was computed using a mask in each position at a time. The results are shown in Fig. 7 (bottom).
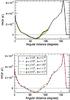 |
Fig. 7 Top: comparison between the SEQ quadrant for the TPCF using the KQ85 mask + these circular masks centered on the cold spot can be seen with a radius of 5 degrees (red line), 10 degrees (yellow line) and 15 degrees (green line). The black line refers to the function without masking the Cold Spot. Bottom: TPCF for the WMAP7 map using KQ85 + circular masks centered on the specified angles with a radius of 15 degrees each. The red dashed-dot curve refers to the Cold Spot region. |
4. Discussion
Our analyses indicate that, even though the excess of power in the SEQ is independent of the chosen Galactic cut, the largest asymmetry between the SEQ and the other quadrants depends on the Galactic cut and also on which ILC map is used. Considering the analysis performed only with the KQ85 mask, the biggest asymmetry was found between the SEQ and the NEQ for all three ILC maps, the largest corresponding to the WILC5 map. Moreover, when only the KQ85 mask was used, the asymmetries between the SEQ and the other three quadrants for the other Galactic cuts are smaller. However, we found that the chance of having any asymmetry is quite low. Table 4 shows that most of the sigma ratios between the SEQ and the other three quadrants obtained from the TPCF computed from the data (see Eq. (3)) are outside the standard deviation interval of the sigma ratios obtained from the TPCF computed for the MC simulations.
Sigma ratios for the simulated CMB maps considering the ΛCDM model and the three Galactic cuts.
Indeed, most of the sigma ratios between the SEQ and any other quadrant obtained from the TPCF computed for the simulated sky maps average one, as expected, because we generated realizations with randomly distributed temperature fluctuations in the sky.
Finally, it is possible to see that the excess of power in the SEQ is independent of the chosen Galactic cut. However, the chosen Galactic cut influences the size of this excess in comparison to the other quadrants. Furthermore, using the asymmetric mask does not change our results drastically. We also notice this by analyzing the effect of the new mask provided for the WMAP sseven-year data release (KQ85y7) in TPCF. There is no clear difference in the results of the TPCF for each quadrant using the WILC7 + KQ85 and WILC7 + KQ85y7 data sets, as can be seen from Figs. 8 and 9. The values found for the sigma ratios between the SEQ and the other quadrants in this last case were σSEQ/σNWQ = 4.6, σSEQ/σSWQ = 4.7 and σSEQ/σNEQ = 6.8 (see Table 1 for comparison).
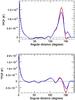 |
Fig. 8 Comparison between NWQ (top) and NEQ (bottom) for the TPCF using the KQ85 mask (solid blue line) and the KQ85y7 (solid red line). |
Furthermore, using the MΛCDM, which includes the WMAP best-fit values for the quadrupole and octopole, instead of the ΛCDM to generate the MC simulations does not noticeably change neither P1 nor P2, as can be seen in Table 5. Based upon these results, we are confident to state that the low values for the quadrupole and octopole in the data are not responsible for this quadrant asymmetry.
Finally, no evidence for a relationship between the SEQ asymmetry and the cold spot was found. The excess of power in the SEQ was most evident above the angular distance of 100 degrees. By masking the cold spot, we were able to identify small differences in the behavior of the TPCF, all of them remaining within the angular distance of 100 degrees. The same result was found for the other randomly chosen regions in the SEQ quadrant and no evidence was found that can relate the reported asymmetry to any of these chosen regions in the SEQ.
5. Conclusion
We found a significant asymmetry between the SEQ and the other quadrants by considering the temperature WMAP ILC maps. We calculated the probability of occurrence for this asymmetry using MC simulations, and 1 out of 1000 simulations for the ΛCDM model corresponded to the SEQ-NEQ asymmetry found in the WILC7 using the KQ85 mask. We also showed that different Galactic cuts do not influence the result in a significant way, leading us to believe that this effect is not caused by the asymmetric mask. Moreover, the use of KQ85y7 preserves the same asymmetries (SEQ-NEQ, SEQ-SWQ and SEQ-NWQ), as expected. Considering all Galactic cuts and maps used, the highest probability of having an asymmetry is 8.5%, for the WILC5 with the KQ85 mask + data clipping for | b | < 10°.
Calculated probabilities of finding the same asymmetries as in WMAP data in the MC simulations using the WMAP KQ85 mask and considering the MΛCDM model.
The possibility that the asymmetries described in this work were related to the reported lack of power in the quadrupole and octopole was tested. We constructed simulations based on a modified ΛCDM model, adjusting the amplitudes of the quadrupole and the octopole to their observational WMAP values. No explicit relation between the quadrant asymmetries and the low amplitude of the first two non-zero multipoles was found.
Furthermore, we found no evidence of a relationship between the cold spot region and the SEQ excess of power, as pointed out by Bernui (2009), who suggested that the Cold Spot is responsible for 60% of the Southern Hemisphere power. Masking this region and some other regions in the SEQ does not change the TPCF in a significant way, leading us to conclude that the asymmetries between the SEQ and the other quadrants are not related to any specific region in the SEQ.
We conclude that the excess of power found in the SEQ is likely related to the north-south asymmetry, in which the South Hemisphere presents more power than the Northern one (see Eriksen et al. 2004a; Hansen et al. 2004a; and Paci et al. 2010; Pietrobon et al. 2010; Vielva & Sanz 2010, for recent discussions on the topic). Our results support the claims that there is indeed a north-south asymmetry and show that the excess of power occurs in the SEQ. Additional investigation is needed to find a better explanation for the north-south asymmetry.
An explanation for these asymmetries is still missing. They could be primordial or caused by residual foregrounds or systematic effects. The upcoming CMB data from the Planck satellite when analyzed with more accurate foreground removal techniques will enable us to study in more detail the CMB anomalies reported in the literature.
Finally, in addition to the SEQ excess of power, we can notice a lack of correlation in the SWQ, NWQ and NEQ in the TPCF in scales between 20 and 100 degrees for all Galactic cuts in the present work (see Figs. 1 − 6). A lack of correlation in the TPCF was already reported by Copi et al. (2007) in scales above 60 degrees for a full sky analysis using the Kp0 mask in the first and third year of WMAP data.
Acknowledgments
We would like to thank Paolo Cabella for useful discussions. We also acknowledge the use of HEALPix packages, of the Legacy Archive for Microwave Background Data analysis (LAMBDA). L. Santos thanks CAPES-Brazil for financial support. T. Villela acknowledges CNPq support through grant 308113/2010-1. C. A. Wuensche acknowledges CNPq grant 308202/2010-4.
References
- Aluri, P. K., & Jain, P. 2012, MNRAS, 419, 3378 [NASA ADS] [CrossRef] [Google Scholar]
- Ayaita, Y., Weber, M., & Wetterich, C. 2010, Phys. Rev. D, 81, 3507 [NASA ADS] [CrossRef] [Google Scholar]
- Abramo, L. R., Bernui, A., Ferreira, I. S., Villela, T., & Wuensche, C. A. 2006, Phys. Rev. D, 74, 3506 [Google Scholar]
- Bennett, C. L., Halpern, M., Hinshaw, G., et al. 2003, ApJS, 148, 1 [NASA ADS] [CrossRef] [Google Scholar]
- Bennett, C. L., Hill, R. S., Hinshaw, G., et al. 2011, ApJS, 192, 17 [NASA ADS] [CrossRef] [Google Scholar]
- Bernui, A. 2009, Phys. Rev. D, 80, 123010 [NASA ADS] [CrossRef] [Google Scholar]
- Bernui, A., Villela, T., Wuensche, C. A., Leonardi, R., & Ferreira, I. 2006, A&A, 454, 409 [NASA ADS] [CrossRef] [EDP Sciences] [Google Scholar]
- Bielewicz, P., Górski, K. M., & Banday, A. J. 2004, MNRAS, 355, 1283 [NASA ADS] [CrossRef] [Google Scholar]
- Bielewicz, P., Eriksen, H. K., Banday, A. J., Górski, K. M., & Lilje, P. B. 2005, ApJ, 635, 750 [NASA ADS] [CrossRef] [Google Scholar]
- Cayón, L. 2010, MNRAS, 405, 1084 [NASA ADS] [Google Scholar]
- Copi, C. J., Huterer, D., & Starkman, G. D. 2004, Phys. Rev. D, 70, 3515 [Google Scholar]
- Copi, C. J., Huterer, D., Schwarz, D. J., & Starkman, G. D. 2006, MNRAS, 367, 79 [NASA ADS] [CrossRef] [Google Scholar]
- Copi, C. J., Huterer, D., Schwarz, D. J., & Starkman, G. D. 2007, Phys. Rev. D, 75, 3507 [NASA ADS] [Google Scholar]
- Cruz, M., Martínez-González, E., Vielva, P., & Cayón, L. 2005, MNRAS, 356, 29 [NASA ADS] [CrossRef] [Google Scholar]
- Cruz, M., Cayón, L., Martínez-González, E., Vielva, P., & Jin, J. 2007, ApJ, 655, 11 [NASA ADS] [CrossRef] [Google Scholar]
- Cruz, M., Vielva, P., Martínez-González, E., & Barreiro, R. B. 2011, MNRAS, 412, 2383 [NASA ADS] [CrossRef] [Google Scholar]
- de Oliveira-Costa, A., Tegmark, M., Zaldarriaga, M., & Hamilton, A. 2004, Phys. Rev. D, 69, 3516 [Google Scholar]
- Donoghue, E. P., & Donoghue, J. F. 2005, Phys. Rev. D, 71, 043002 [NASA ADS] [CrossRef] [MathSciNet] [Google Scholar]
- Efstathiou, G. 2003, MNRAS, 277, L49 [Google Scholar]
- Eriksen, H. K., Hansen, F. K., Banday, A. J., Górski, K. M., & Lilje, P. B. 2004a, ApJ, 605, 14 [NASA ADS] [CrossRef] [Google Scholar]
- Eriksen, H. K., Novikov, D. I., Lilje, P. B., Banday, A. J., & Górski, K. M. 2004b, ApJ, 612, 64 [NASA ADS] [CrossRef] [Google Scholar]
- Frommert, M., & Ensslin, T. A. 2010, MNRAS, 403, 1739 [NASA ADS] [CrossRef] [Google Scholar]
- Gorski, K. M., Hivon, E., Banday, A. J., et al. 2005, ApJ, 622, 759 [NASA ADS] [CrossRef] [Google Scholar]
- Gold, B., Bennett, C. L., Hill, R. S., et al. 2009, ApJS, 180, 265 [NASA ADS] [CrossRef] [Google Scholar]
- Gruppuso, A., & Burigana, C., 2010, JCAP, 8, 4 [Google Scholar]
- Hansen, F. K., Cabella, P., Marinucci, D., & Vittorio, N. 2004a, ApJ, 607, L67 [NASA ADS] [CrossRef] [Google Scholar]
- Hansen, F. K., Banday, A. J., & Górski, K. M. 2004b, MNRAS, 354, 641 [NASA ADS] [CrossRef] [Google Scholar]
- Hinshaw, G., Nolta, M. R., Bennett, C. L., et al. 2007, ApJ, 170, 288 [Google Scholar]
- Hinshaw, G., Weiland, J. L., Hill, R. S., et al. 2009, ApJS, 180, 225 [NASA ADS] [CrossRef] [Google Scholar]
- Hoftuft, J., Eriksen, H. K., Banday, A. J., et al. 2009, ApJ, 699, 985 [NASA ADS] [CrossRef] [Google Scholar]
- Jarosik, N., Bennett, C. L., Dunkley, J., et al. 2011, ApJS, 192, 14 [NASA ADS] [CrossRef] [Google Scholar]
- Kim, J., & Naselsky, P. 2010, ApJ, 714, L265 [NASA ADS] [CrossRef] [Google Scholar]
- Land, K., & Magueijo, J. 2005, MNRAS, 357, 994 [NASA ADS] [CrossRef] [Google Scholar]
- Mukherjee, P., & Wang, Y. 2003, ApJ, 599, 1 [NASA ADS] [CrossRef] [Google Scholar]
- Naselsky, P., Zhao, W., Kim, J., & Chen, S. 2012, ApJ, 749, 31 [NASA ADS] [CrossRef] [Google Scholar]
- Penzias, A., & Wilson, R. 1965, ApJ, 142, 419 [NASA ADS] [CrossRef] [Google Scholar]
- Paci, F., Gruppuso, A., Finelli, F., et al. 2010, MNRAS, 407, 399 [NASA ADS] [CrossRef] [Google Scholar]
- Pietrobon, D., Cabella, P., Balbi, A., et al. 2010, MNRAS, 402, 34 [Google Scholar]
- Schwarz, D. J., Starkman, G. D., Huterer, D., & Copi, C. J. 2004, Phys. Rev. Lett., 93, 1301 [Google Scholar]
- Smoot, G. F., Bennett, C. L., Kogut, A., et al. 1992, ApJ, 396, L1 [NASA ADS] [CrossRef] [Google Scholar]
- Spergel, D. N., Verde, L., Peiris, H. V., et al. 2003, ApJS, 148, 175 [NASA ADS] [CrossRef] [Google Scholar]
- Strukov, I. A., & Skulachev, D. P. 1984, Sov. Astron. Lett., 10, 1 [NASA ADS] [Google Scholar]
- Tegmark, M., de Oliveira-Costa, A., & Hamilton, A. J. 2003, Phys. Rev. D, 68, 3523 [Google Scholar]
- Vielva, P. 2010, Adv. Astron., 2010, 77 [NASA ADS] [CrossRef] [Google Scholar]
- Vielva, P., & Sanz, J. L. 2010, MNRAS, 404, 895 [NASA ADS] [CrossRef] [Google Scholar]
- Vielva, P., Martínez-González, E., Barreiro, R. B., Sanz, J. L., & Cayón, L. 2004, ApJ, 609, 22 [NASA ADS] [CrossRef] [Google Scholar]
- Vielva, P., Wiaux, Y., Martínez-González, E., & Vandergheynst, P. 2007, MNRAS, 381, 932 [NASA ADS] [CrossRef] [Google Scholar]
- Wiaux, Y., Vielva, P., Martínez-González, E., & Vandergheynst, P. 2006, Phys. Rev. Lett., 96, 1303 [Google Scholar]
All Tables
Calculated probabilities of finding the same asymmetries as in WMAP data in the MC simulations using the WMAP KQ85 mask and considering the ΛCDM model.
Calculated probabilities of finding the same asymmetries as in WMAP data in the MC simulations using the WMAP KQ85 mask + | b | < 10° Galactic cut and considering the ΛCDM model.
Calculated probabilities of finding the same asymmetries as in WMAP data in the MC simulations using the | b | < 10° Galactic cut and considering the ΛCDM model.
Sigma ratios for the simulated CMB maps considering the ΛCDM model and the three Galactic cuts.
Calculated probabilities of finding the same asymmetries as in WMAP data in the MC simulations using the WMAP KQ85 mask and considering the MΛCDM model.
All Figures
|
Fig. 1 TPCF curves computed for the WILC7 map using the WMAP KQ85 mask, smoothed for illustration purposes. The NWQ (top) and the NEQ (bottom) appear as solid red lines. The shadow part depicts the standard deviation intervals for 1000 simulated maps produced with the ΛCDM spectrum. |
| In the text | |
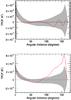 |
Fig. 2 Same as Fig. 1, but now with the SWQ at the top and the SEQ at the bottom. |
| In the text | |
|
Fig. 3 Same as Fig. 1, but now using the WMAP KQ85 mask + | b | < 10° Galactic cut in the temperature WMAP7 data. From top to bottom, the curves refer to the NWQ and the NEQ, respectively. |
| In the text | |
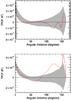 |
Fig. 4 Same as Fig. 3. From top to bottom, the curves refer to the SWQ and the SEQ, respectively. |
| In the text | |
|
Fig. 5 Same as Figs. 1 − 4, but now using | b | < 10° Galactic cut, again in the temperature WILC7 map. From top to bottom the curves refer to the NWQ and the NEQ, respectively. |
| In the text | |
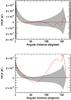 |
Fig. 6 Same as Fig. 5 for the SWQ (top) and the SEQ (bottom). |
| In the text | |
|
Fig. 7 Top: comparison between the SEQ quadrant for the TPCF using the KQ85 mask + these circular masks centered on the cold spot can be seen with a radius of 5 degrees (red line), 10 degrees (yellow line) and 15 degrees (green line). The black line refers to the function without masking the Cold Spot. Bottom: TPCF for the WMAP7 map using KQ85 + circular masks centered on the specified angles with a radius of 15 degrees each. The red dashed-dot curve refers to the Cold Spot region. |
| In the text | |
|
Fig. 8 Comparison between NWQ (top) and NEQ (bottom) for the TPCF using the KQ85 mask (solid blue line) and the KQ85y7 (solid red line). |
| In the text | |
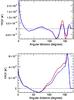 |
Fig. 9 Same as Fig. 8 for the SWQ (top) and the SEQ (bottom). |
| In the text | |
Current usage metrics show cumulative count of Article Views (full-text article views including HTML views, PDF and ePub downloads, according to the available data) and Abstracts Views on Vision4Press platform.
Data correspond to usage on the plateform after 2015. The current usage metrics is available 48-96 hours after online publication and is updated daily on week days.
Initial download of the metrics may take a while.