Fig. 7
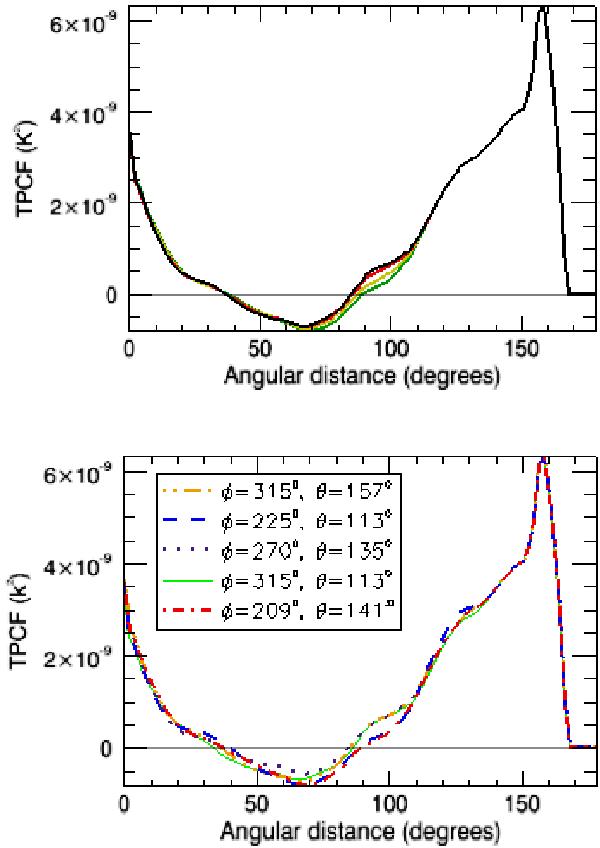
Top: comparison between the SEQ quadrant for the TPCF using the KQ85 mask + these circular masks centered on the cold spot can be seen with a radius of 5 degrees (red line), 10 degrees (yellow line) and 15 degrees (green line). The black line refers to the function without masking the Cold Spot. Bottom: TPCF for the WMAP7 map using KQ85 + circular masks centered on the specified angles with a radius of 15 degrees each. The red dashed-dot curve refers to the Cold Spot region.
Current usage metrics show cumulative count of Article Views (full-text article views including HTML views, PDF and ePub downloads, according to the available data) and Abstracts Views on Vision4Press platform.
Data correspond to usage on the plateform after 2015. The current usage metrics is available 48-96 hours after online publication and is updated daily on week days.
Initial download of the metrics may take a while.