Free Access
Fig. 1
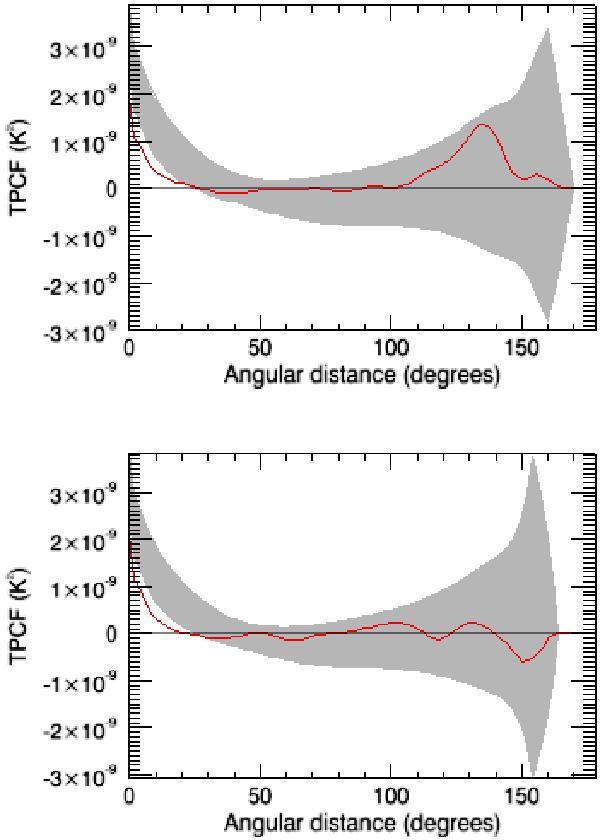
TPCF curves computed for the WILC7 map using the WMAP KQ85 mask, smoothed for illustration purposes. The NWQ (top) and the NEQ (bottom) appear as solid red lines. The shadow part depicts the standard deviation intervals for 1000 simulated maps produced with the ΛCDM spectrum.
This figure is made of several images, please see below:
Current usage metrics show cumulative count of Article Views (full-text article views including HTML views, PDF and ePub downloads, according to the available data) and Abstracts Views on Vision4Press platform.
Data correspond to usage on the plateform after 2015. The current usage metrics is available 48-96 hours after online publication and is updated daily on week days.
Initial download of the metrics may take a while.