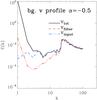
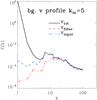
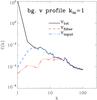
Fig. 4
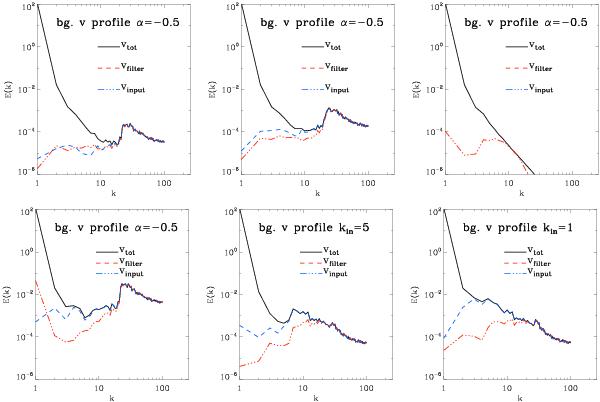
Power spectra of velocity field for tests b), d) e) and f), g) and h) of Fig. 3. The black lines show the total input velocity field, the blue lines the input turbulent field, and the red lines the field reconstructed with our algorithm. Note that the low k cut-off in the turbulent spectra of test h) is caused by our procedure of extracting small patches of turbulent motions in the simulated volume, while the original turbulent velocity field has by construction an unbroken power-law spectrum from k = 1 on.
Current usage metrics show cumulative count of Article Views (full-text article views including HTML views, PDF and ePub downloads, according to the available data) and Abstracts Views on Vision4Press platform.
Data correspond to usage on the plateform after 2015. The current usage metrics is available 48-96 hours after online publication and is updated daily on week days.
Initial download of the metrics may take a while.