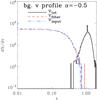
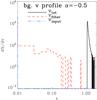
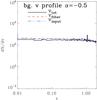
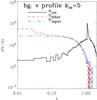
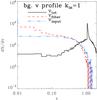
Fig. 3
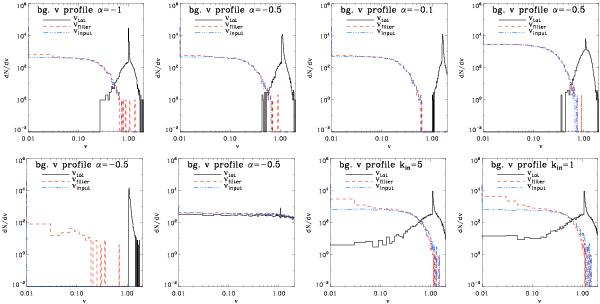
Distribution of the velocity modulus for the numerical tests described in Sect. 2.1. From top left to bottom right: a) background velocity profile with α = −1 and N = 10 additional patches of turbulent field with σv/vo = 0.3; b) same as a), but with α = −0.5; c) same as a), but with α = −0.1; d) same as b), but with N = 50; e) only background velocity field with α = −0.5, no turbulent patches; f) as in b), but with turbulent patches everywhere; g) as in b), but assuming an outer scale of turbulent motions kin = 5; h) as in b), but assuming an outer scale of turbulent motions kin = 1. In each panel, the black lines show the total input velocity field, the blue lines the input turbulent field, and the red lines the field reconstructed with our algorithm.
Current usage metrics show cumulative count of Article Views (full-text article views including HTML views, PDF and ePub downloads, according to the available data) and Abstracts Views on Vision4Press platform.
Data correspond to usage on the plateform after 2015. The current usage metrics is available 48-96 hours after online publication and is updated daily on week days.
Initial download of the metrics may take a while.