Fig. 21
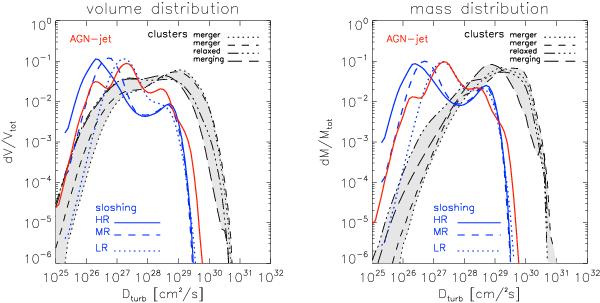
Volume (left) and mass (right) distribution of turbulent diffusion for all runs studied in this paper. We show in red the turbulent diffusion from the AGN-jet of Hydra, in blue the distributions of turbulent diffusion from the sloshing core in Virgo (we plot with different line-styles the distributions at different resolution, as in Sect. 3.2), and in black the turbulent diffusion from cosmological clusters (the different line-styles are for each different object studied in Sect. 3.1, while the shadowed region shows the uncertainty in the overall cluster sample).
Current usage metrics show cumulative count of Article Views (full-text article views including HTML views, PDF and ePub downloads, according to the available data) and Abstracts Views on Vision4Press platform.
Data correspond to usage on the plateform after 2015. The current usage metrics is available 48-96 hours after online publication and is updated daily on week days.
Initial download of the metrics may take a while.