Fig. 2
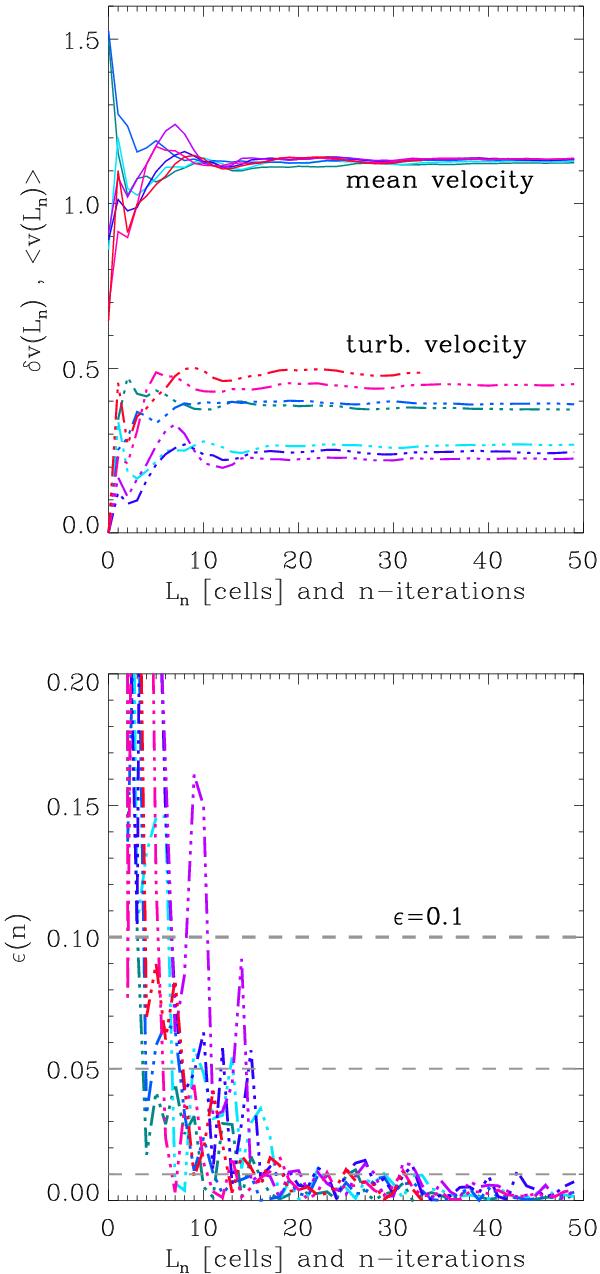
Trend with number of iterations of the mean local velocity field and turbulent velocity field reconstructed by our method for eight random points extracted in the first test of Fig. 1. The top panel shows how the mean velocity and the turbulent velocity of each points change as the number of iterations is increased (the iterations are stopped when ϵ ≤ 10-3; the lower panel shows the trend of the fractional increase of the turbulent velocity field with the number of iterations (Eq. (5)) for the same points. Our fiducial threshold value to stop the iterations, ϵ = 0.1, as well as ϵ = 0.05 and ϵ = 0.01 is shown for comparison.
Current usage metrics show cumulative count of Article Views (full-text article views including HTML views, PDF and ePub downloads, according to the available data) and Abstracts Views on Vision4Press platform.
Data correspond to usage on the plateform after 2015. The current usage metrics is available 48-96 hours after online publication and is updated daily on week days.
Initial download of the metrics may take a while.