Free Access
Fig. 19
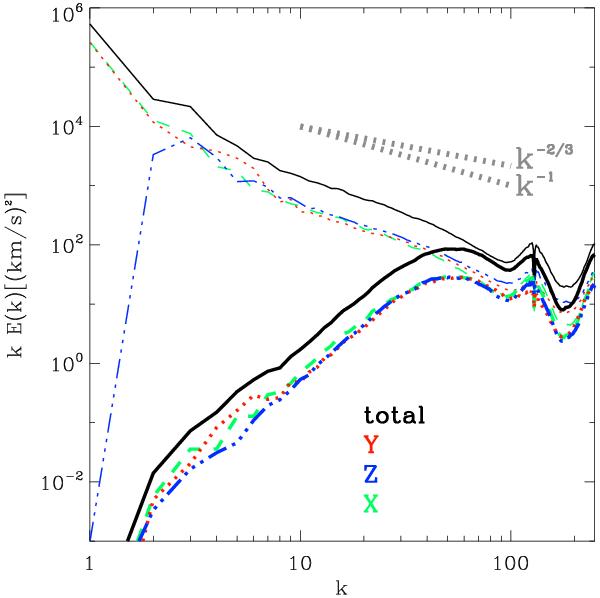
Power spectra for the total velocity field (thin upper lines) and for the turbulent velocity field (lower thick lines) for the same region as in Fig. 17. The different colour-coding shows the spectra for the component of velocities along the three axes of the simulation (direction “Y” is the propagation axis of the jet).
Current usage metrics show cumulative count of Article Views (full-text article views including HTML views, PDF and ePub downloads, according to the available data) and Abstracts Views on Vision4Press platform.
Data correspond to usage on the plateform after 2015. The current usage metrics is available 48-96 hours after online publication and is updated daily on week days.
Initial download of the metrics may take a while.