Free Access
Fig. 17
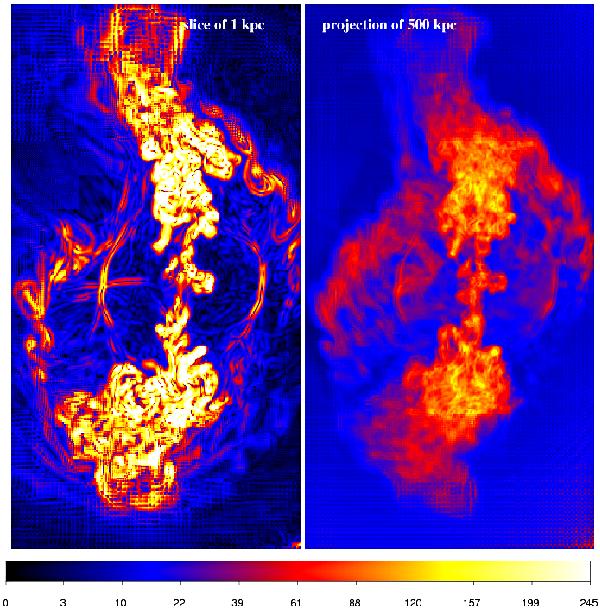
Maps of turbulent velocity module (in units of [km s-1]) for the a slice of 1 kpc centred on the Hydra run (left) and for the volume-weighted projection across 500 kpc (right). Each image has sides 300 × 500 kpc.
Current usage metrics show cumulative count of Article Views (full-text article views including HTML views, PDF and ePub downloads, according to the available data) and Abstracts Views on Vision4Press platform.
Data correspond to usage on the plateform after 2015. The current usage metrics is available 48-96 hours after online publication and is updated daily on week days.
Initial download of the metrics may take a while.