Fig. 16
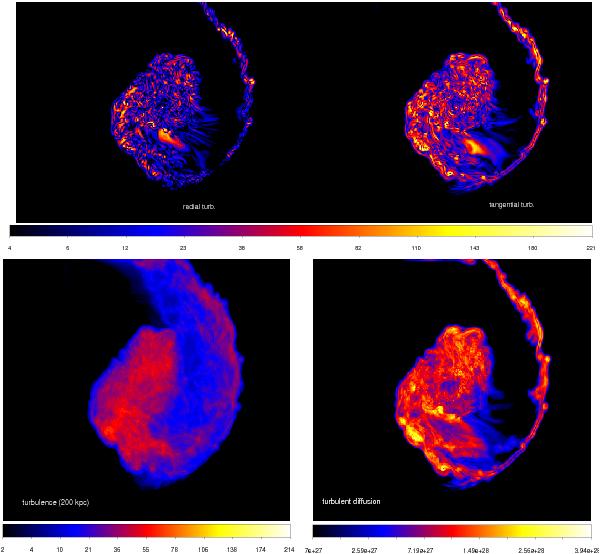
Top panels: slices of 1 kpc through the centre of the Virgo run HR, showing the radial component of the turbulent velocity field (left, in [km s-1]) and the tangential one (right, in [km s-1]). Bottom panels: volume-averaged maps of turbulent velocity field (im [km s-1]) for a line of sight of 200 kpc in run HR (left panel) and maps of turbulent diffusion for a slab of 20 kpc (right, in units of [cm2 s-1]). Each image has sides 400 × 500 kpc.
Current usage metrics show cumulative count of Article Views (full-text article views including HTML views, PDF and ePub downloads, according to the available data) and Abstracts Views on Vision4Press platform.
Data correspond to usage on the plateform after 2015. The current usage metrics is available 48-96 hours after online publication and is updated daily on week days.
Initial download of the metrics may take a while.