Fig. 13
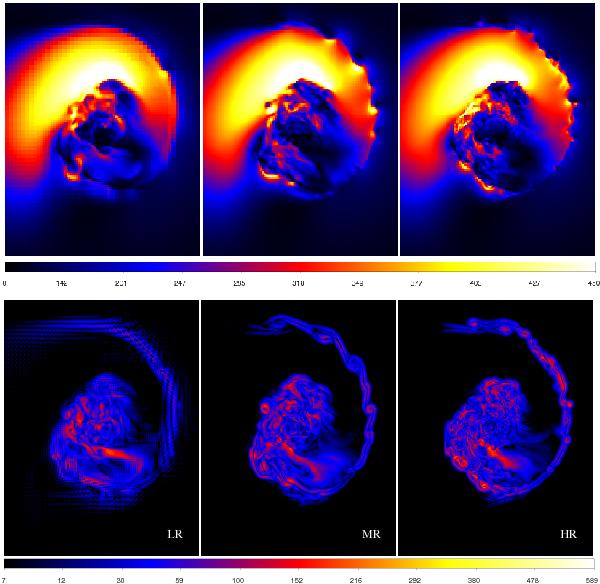
Gas sloshing in the VIRGO cluster, triggered by a minor merger (Roediger et al. 2011). The images are slices through the centre of the simulation box, showing the absolute value of the total (top panels) and turbulent (lower panels) velocity for the three different resolutions: 2 kpc (LR), 1 kpc (MR) and 0.5 kpc (HR). The colour coding is in [km s-1], each image has sides ~250 × 300 kpc.
Current usage metrics show cumulative count of Article Views (full-text article views including HTML views, PDF and ePub downloads, according to the available data) and Abstracts Views on Vision4Press platform.
Data correspond to usage on the plateform after 2015. The current usage metrics is available 48-96 hours after online publication and is updated daily on week days.
Initial download of the metrics may take a while.