Fig. 10
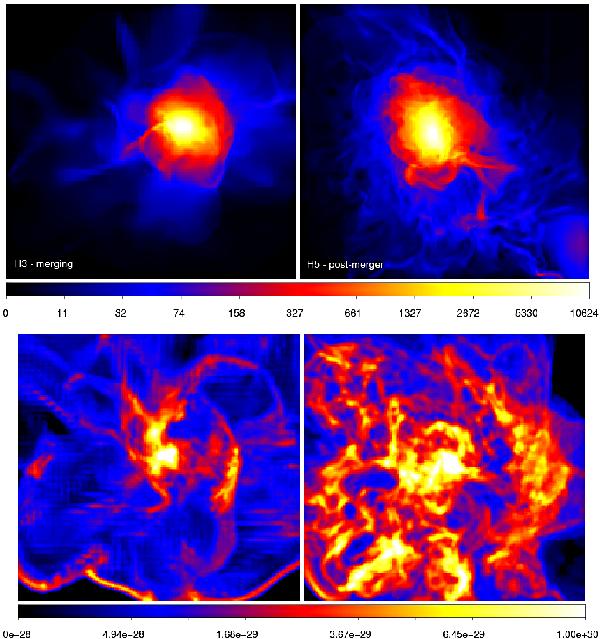
Top panel: map of gas density for a slice of 100 kpc h-1 through the centre of the major merger cluster H5 (right column) and of the merging cluster H3 (left column). The top row shows the projected average gas density (in [ρ/ρcr,b], where ρcr,b is the critical baryon density), the bottom row shows the projected map of the turbulent diffusion for the same regions (in units of [cm2 s-1]).
Current usage metrics show cumulative count of Article Views (full-text article views including HTML views, PDF and ePub downloads, according to the available data) and Abstracts Views on Vision4Press platform.
Data correspond to usage on the plateform after 2015. The current usage metrics is available 48-96 hours after online publication and is updated daily on week days.
Initial download of the metrics may take a while.