Fig. 1
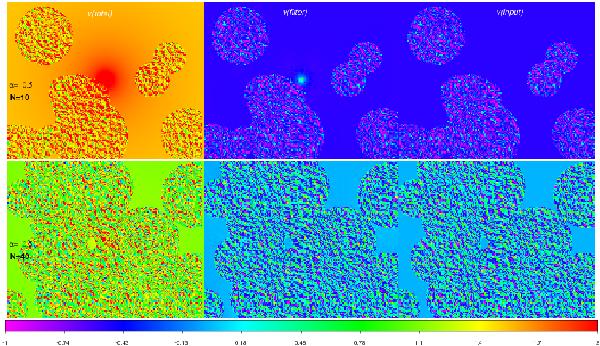
Maps of absolute value of the total velocity field (left, in arbitrary code units), of the turbulent velocity field reconstructed with our method (centre) and of the input turbulent velocity field (right) for two tests with a different slope for the background velocity profile (α) and for the number of injected turbulent patches, N (see Sect. 2.1 for details). In the top row we assumed α = −0.5, N = 10 and σv/vtot = 0.3, while in the bottom row we assumed α = −0.5, N = 40 and σv/vtot = 3.
Current usage metrics show cumulative count of Article Views (full-text article views including HTML views, PDF and ePub downloads, according to the available data) and Abstracts Views on Vision4Press platform.
Data correspond to usage on the plateform after 2015. The current usage metrics is available 48-96 hours after online publication and is updated daily on week days.
Initial download of the metrics may take a while.