| Issue |
A&A
Volume 544, August 2012
|
|
|---|---|---|
| Article Number | A3 | |
| Number of page(s) | 7 | |
| Section | Interstellar and circumstellar matter | |
| DOI | https://doi.org/10.1051/0004-6361/201118685 | |
| Published online | 17 July 2012 | |
Fermi-LAT constraints on the pulsar wind nebula nature of HESS J1857+026
1 Centre d’Études Nucléaires de Bordeaux Gradignan, Université Bordeaux 1, CNRS/IN2p3, 33175 Gradignan, France
e-mail: This email address is being protected from spambots. You need JavaScript enabled to view it.
; This email address is being protected from spambots. You need JavaScript enabled to view it.
2 Max-Planck-Institut für Kernphysik, 69029 Heidelberg, Germany
e-mail: This email address is being protected from spambots. You need JavaScript enabled to view it.
3 Landessternwarte, Universität Heidelberg, Königstuhl, 69117 Heidelberg, Germany
4 W. W. Hansen Experimental Physics Laboratory, Kavli Institute for Particle Astrophysics and Cosmology, Department of Physics and SLAC National Accelerator Laboratory, Stanford University, Stanford, CA 94305, USA
e-mail: This email address is being protected from spambots. You need JavaScript enabled to view it.
5 Columbia Astrophysics Laboratory, Columbia University, New York, NY 10027, USA
6 ASTRON, The Netherlands Institute for Radio Astronomy, Postbus 2, 7990 AA, Dwingeloo, The Netherlands
7 Astronomical Institute “Anton Pannekoek”, University of Amsterdam, Science Park 904, 1098 XH Amsterdam, The Netherlands
8 Department of Physics, McGill University, Montreal, PQ H3A 2T8, Canada
9 X-ray Astrophysics Laboratory and CRESST, NASA Goddard Space Flight Center, Code 662, Greenbelt, MD 20771, USA
10 Laboratoire AIM, CEA-IRFU/CNRS/Université Paris Diderot, Service d’Astrophysique, CEA Saclay, 91191 Gif-sur-Yvette, France
11 Jodrell Bank Centre for Astrophysics, School of Physics and Astronomy, The University of Manchester, M13 9PL, UK
12 CSIRO Astronomy and Space Science, Australia Telescope National Facility, Epping NSW 1710, Australia
13 Institut de Ciències de l’Espai (IEEE-CSIC), Campus UAB, 08193 Barcelona, Spain
Received: 20 December 2011
Accepted: 23 May 2012
Abstract
Context. Since its launch, the Fermi satellite has firmly identified 5 pulsar wind nebulae plus a large number of candidates, all powered by young and energetic pulsars. HESS J1857 + 026 is a spatially extended γ-ray source detected by H.E.S.S. and classified as a possible pulsar wind nebula candidate powered by PSR J1856 + 0245.
Aims. We search for γ-ray pulsations from PSR J1856+0245 and explore the characteristics of its associated pulsar wind nebula.
Methods. Using a rotational ephemeris obtained from the Lovell telescope at Jodrell Bank Observatory at 1.5 GHz, we phase-fold 36 months of γ-ray data acquired by the Large Area Telescope (LAT) aboard Fermi. We also perform a complete γ-ray spectral and morphological analysis.
Results. No γ-ray pulsations were detected from PSR J1856+0245. However, significant emission is detected at a position coincident with the TeV source HESS J1857 + 026. The γ-ray spectrum is well described by a simple power-law with a spectral index of Γ = 1.53 ± 0.11stat ± 0.55syst and an energy flux of G(0.1–100 GeV) = (2.71 ± 0.52stat ± 1.51syst) × 10-11 erg cm-2 s-1. The γ-ray luminosity is LPWNγ (0.1–100 GeV)=(2.5 ± 0.5stat ± 1.5syst) × 1035 (d/9 kpc)2 erg s-1, assuming a distance of 9 kpc. This implies a γ-ray efficiency of ~5% for Ė = 4.6 × 1036 erg s-1, in the range expected for pulsar wind nebulae. Detailed multi-wavelength modeling provides new constraints on its pulsar wind nebula nature.
Key words: pulsars: general / pulsars: individual: PSR J1856+0245 / ISM: individual objects: HESS J1857+026 / gamma rays: general
Funded by contract ERC-StG-259391 from the European Community.
© ESO, 2012
1. Introduction
Pulsar wind nebulae (PWNe) are bubbles of shocked relativistic particles produced by the interaction of the pulsar’s wind with the surrounding medium (Gaensler el al. 2006). Since 2003, the continuous observations of the Galactic plane by  erenkov telescopes have yielded the detection of more than 60 Galactic TeV sources. Among them, PWNe are the dominant class with 29 firm identifications. In the GeV energy range, 7 PWNe have been firmly identified by the Fermi-LAT, all of them having their Inverse Compton (IC) peak at energies higher than 100 GeV. They are all powered by energetic pulsars and their γ-efficiencies are ~1%, consistent with TeV observations (Ackermann et al. 2011).
The presence of a pulsar close to the source position is an important clue to identify a PWN, which often requires information from the radio/X-ray wavelengths. Radio/X-ray PWNe are often associated with TeV extended sources offset from their pulsars, which can be explained by an inhomogeneous environment (Hinton et al. 2010). In such sources, TeV radiation can be explained by IC scattering of accelerated leptons on ambient photon fields (CMB, IR, ...) or by π0 decay from the interaction of accelerated hadrons with nuclei of the interstellar medium.
HESS J1857+026 is a very high energy (VHE) γ-ray source detected by H.E.S.S. during the Galactic Plane Survey (Aharonian et al. 2008). The extended (~0.11°) TeV source was identified as a PWN candidate after the discovery of PSR J1856+0245 (offset ~0.12°) in the Arecibo PALFA survey (Hessels et al. 2008) with a dispersion measure (DM) of 622 cm-3 pc. Recently, MAGIC reported a measured extension in the 0.2–1 TeV energy range significantly larger (0.22°) than the extension reported by H.E.S.S. in the 0.6–80 TeV energy range (Klepser et al. 2011). PSR J1856+0245 is an energetic pulsar (Ė = 4.6 × 1036 erg s-1) located in a crowded region, 1.3° from the bright SNR W44 (Abdo et al. 2010) and 0.6° from the fainter SNR HESS J1858+020 on which only an upper limit could be set using Fermi-LAT data (Torres et al. 2011). Significant emission coincident with HESS J1857+026 was observed above 100 GeV using Fermi-LAT observations (Neronov et al. 2010).
Here, we report in detail GeV observations of the HESS J1857+026/PSR J1856+0245 system using Fermi-LAT observations and discuss their implications for the nature of the source.
2. LAT description and data selection
The LAT is a γ-ray telescope that detects photons by conversion into electron-positron pairs and operates in the energy range between 20 MeV and 300 GeV. Details of the instrument and data processing are given in Atwood et al. (2009). The on-orbit calibration is described in Abdo et al. (2009a).
The following analysis was performed using 36 months of data collected from August 4, 2008 to August 31, 2011 within a 10 × 10° square around the position of HESS J1857+026 aligned with Galactic coordinates. We excluded γ-rays coming from a zenith angle larger than 100° because of possible contamination from secondary γ-rays from the Earth’s atmosphere (Abdo et al. 2009b). We used the P7 V6 instrument response functions (IRFs), and selected the “Source” events which correspond to the best compromise between the number of selected photons and the charged particle residual background for the study of point-like or slightly extended sources.
3. Data analysis
3.1. Timing analysis of PSR J1856+0245
With its large spin-down power, PSR J1856+0245 is one of the more energetic radio pulsars known. Its spin period of 80.9 ms and characteristic age of 20.6 kyr are similar to those of the Vela pulsar. The DM and NE2001 electron density model of the Galaxy assign PSR J1856+0245 a distance of ~9 kpc (Cordes et al. 2002).
This pulsar is not monitored as part of the LAT pulsar timing campaign (Smith et al. 2008), as it was discovered subsequently, but has nevertheless been regularly observed with the Lovell telescope at Jodrell Bank Observatory (Hobbs et al. 2004). The ephemeris of PSR J1856+0245 used in the analysis was obtained using 82 observations at 1.5 GHz made with the Lovell telescope between May 4, 2008 and September 4, 2011. The event arrival times were corrected to the solar system barycenter using the JPL DE405 Solar System ephemeris. The TEMPO2 timing package (Hobbs et al. 2006) was then used to build the timing solution. We fit the radio times of arrival (TOAs) to the pulsar rotation frequency and first four derivatives (in order to remove timing noise). By including a fourth derivative the RMS of the timing residuals decreases by about 30%, from 1.55 ms to 1.08 ms, equivalent to a decrease from 19 to 13 milliperiods. The reduced χ2 of the fit also decreases significantly, from 22 to 5. The fit results are summarized in Table 1. This timing solution will be made available through the Fermi Science Support Center1 (FSSC).
Parameters of the fit of the TOAs.
For the LAT analysis, photons with energies above 100 MeV and within a radius of 1.0° of the radio pulsar position α(J2000) = 18h56m50.937s, δ(J2000) = + 02°45′47.046′′ were selected using an energy-dependent cone of radius θ < max(5.12° × (E/100 MeV)-0.8,0.2°) and phase-folded using the radio ephemeris previously described. This choice takes into account the instrument performance and improves the single-photon signal-to-noise ratio over a broad energy range. No significant pulsation was detected for all tested energy bands (100 MeV–300 GeV, 100 MeV–300 MeV, 300 MeV–1 GeV, > 1 GeV). Following the procedure used by Romani et al. (2011), we fitted a point source at the position of PSR J1856+0245 in the 0.1–1 GeV energy range assuming a power-law of index 1.62 and a cut-off energy at 2.8 GeV to derive a 99% Bayesian upper limit on the flux of 3.27 × 10⁻⁸ ph cm-2 s-1, well below typical γ-ray fluxes reported for pulsars detected by Fermi-LAT (Abdo et al. 2010c).
3.2. Spatial and spectral analysis
Two different tools were used to perform the spatial and spectral analysis: gtlike and pointlike. gtlike is a binned maximum-likelihood method (Mattox et al. 1996) implemented in the Science Tools distributed by the FSSC. pointlike is an alternate binned likelihood technique, optimized for characterizing the extension of a source (unlike gtlike), that was extensively tested against gtlike (Kerr 2011). These tools fit a source model to the data along with models for the instrumental, extragalactic and Galactic components of the background. In the following analysis, the Galactic diffuse emission is modeled by the standard LAT diffuse emission ring-hybrid model gal_2yearp7v6_v0.fits. The residual cosmic-ray background and extragalactic radiation are described by a single isotropic component with a spectral shape described by the file iso_p7v6source.txt. The models have been released and described by the Fermi-LAT Collaboration through the FSSC2.
The source significance is measured by a test statistic (TS) defined as  , where L1 corresponds to the likelihood obtained by fitting a model of the source of interest and the background model and L0 corresponds to the likelihood obtained by fitting the background model only. In the following, the correspondence between the significance and the TS value is evaluated from the χ2 distribution with 4 degrees of freedom (position and spectral parameters).
The 41 sources within 15° of HESS J1857+026 in the second Fermi-LAT catalog (Nolan et al. 2012) were taken into account. We refitted all spectral parameters of the 16 sources within 5° around HESS J1857+026. The region includes the bright SNR W44, known to interact with its environment. Extended and only 1.3° from HESS J1857+026, W44 could influence our fit. We refitted it assuming an elliptical ring and obtained results consistent with those of Abdo et al. (2010a). The centroid is located at α = 18h56m, δ = + 01°22′. The fitted semi-major and semi-minor axes are respectively maj/2 = (0.33 ± 0.10stat)°, min/2 = (0.20 ± 0.02stat)°. The angle of the semi-major axis from celestial North, taken positive toward increasing Right Ascension, is (327 ± 22stat)°.
3.2.1. Shape and position of HESS J1857+026 counterpart
Source shape analysis requires the best possible angular resolution. Since the source has a hard spectrum (see Sect. 3.2.2) we made a compromise between statistics and resolution by selecting photons above 10 GeV. This drastically reduces the contribution of the Galactic diffuse background and improves the single-photon angular resolution. Figure 1 (top) presents a LAT TS map in the energy range of 10 GeV to 300 GeV. To each pixel is associated a TS value calculated assuming a point source in its center and fitting only the flux of the source assuming a power-law spectrum with a spectral index of 2. A source coincident with HESS J1857+026 is clearly visible. We determined the extension of the source using pointlike with three different models: a point source, a uniform disk and a Gaussian. No significant extension was obtained above 10 GeV. The GeV emission was fit to position α(J2000) = 18h57m, δ(J2000) = + 02°45′ with an average statistical error of 0.05°, consistent with the H.E.S.S. position, α(J2000) = 18h56m50.80s, δ(J2000) = + 02°45′50.2′′.
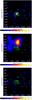 |
Fig. 1 TS maps computed by pointlike. The green crosses show the sources of the 2FGL catalog included in the model, whereas the blue X represents the source we added to the model. The green contours show the H.E.S.S. data (Aharonian et al., 2008). The magenta circle gives the position of PSR J1856+0245. Top: TS map obtained between 10 and 300 GeV. The position of the Fermi-LAT excess is consistent with that of H.E.S.S. Note that HESS J1857+026 is not included in the model. Middle: TS map obtained between 0.1 and 1.3 GeV, showing the residual excess taken into account in our model. Bottom: residual TS map obtained between 10 and 300 GeV when all sources are included. |
3.2.2. Spectral analysis
Figure 1 (Middle) shows a TS map of the region in the energy range 0.1–1.3 GeV. There is excess emission near HESS J1857+026 located at α(J2000) = 18h54m, δ(J2000) = + 02°59′. This excess is inconsistent with that of HESS J1857+026 and was added to the background model. This additional background source was fitted assuming a pure power-law with an integrated flux of F(0.1–100 GeV) = (2.31 ± 0.37stat) × 10-7 ph cm-2 s-1, a spectral index of Γ = 3.18 ± 0.56stat, which gives a significance above 300 MeV of ~3.6σ (TS = 20).
Spectral analysis was performed using gtlike, selecting only 0.3–300 GeV to avoid the low energy range that is dominated by the diffuse Galactic background and subject to large systematic uncertainties. In this energy range, HESS J1857+026 is well described by a pure power-law with an integrated flux extrapolated down to 100 MeV of F(0.1 − 100 GeV) = (5.78 ± 0.85stat ± 3.11syst) × 10-9 ph cm-2 s-1, a spectral index of Γ = 1.53 ± 0.11stat ± 0.55syst and an energy flux of G(0.1 − 100 GeV) = (2.71 ± 0.52stat ± 1.51syst) × 10-11 erg cm-2 s-1, which gives a significance above 300 MeV of ~5.4σ (TS = 39). The residual TS map after fit in Fig. 1 (bottom) shows no significant excess.
Fermi-LAT spectral points for HESS J1857+026 were obtained by splitting the 0.3–100 GeV range into 4 logarithmically-spaced energy bins plus a bin between 100 and 300 GeV which contains 22 photons corresponding to a TS of 14, shown in Fig. 2. A 99% C.L. upper limit is computed when TS < 10 using the approach of Nolan et al. (2012). The errors on the spectral points represent the statistical and systematic uncertainties added in quadrature.
Three main systematic uncertainties can affect the LAT flux estimate for a point source: uncertainties in the Galactic diffuse background, uncertainties on the effective area and uncertainties on the source shape. The dominant uncertainty at low energy comes from the Galactic diffuse emission, estimated by changing the normalization of the Galactic diffuse model artificially by ± 6% as in (Abdo 2010b). Since it is computed for P6 IRFs, the 6% factor overestimates the bias. The second systematic is estimated by using modified IRFs. The fact that we do not know the true γ-ray morphology introduces a last source of error. We derived an estimate of the uncertainty on the source shape by using the best Gaussian model obtained by H.E.S.S. We combine these various errors in quadrature to obtain our best estimate of the total systematic error at each energy, which we propagate through to the fit model parameters.
Assuming a distance of 9 kpc and isotropic emission, the γ-ray flux corresponds to  –100 GeV
 erg s-1. Using the pulsar’s Ė, yields a γ-ray efficiency of ~5%, one of the highest PWN efficiencies observed at GeV energies (Ackermann et al. 2011). It is still in the range of expected values for PWNe seen by the Fermi-LAT and is close to the estimate of 3% using H.E.S.S. data (Mattana et al. 2009).
4. Supporting X-ray measurement
To find the flux of a potential X-ray PWN associated with PSR J1856+0245, we analyzed a 39-ks Chandra ACIS-I observation from February 28, 2011 (Obs. ID 12557). These data were recorded in the VFAINT and Timed Exposure (TE) modes and were analyzed using CIAO3 version 4.3.1 with CALDB 4.4.3. PSR J1856+0245 is clearly detected as a point source, but there was no immediate evidence for extended emission surrounding this position. Based on a 30-ks XMM-Newton EPIC pn observation (ObsID 0505920101), the unabsorbed flux of the pulsar in the 2–10 keV range, assuming a power-law spectrum, is  erg s-1. A more in-depth analysis of the X-ray properties of PSR J1856+0245 as well as the XMM data will be presented in Bogdanov et al. (in prep.).
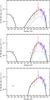 |
Fig. 2 Spectral energy distribution of HESS J1857 + 026 with a simple exponentially cutoff power-law electron spectrum (top), a relativistic Maxwellian plus power-law electron spectrum (middle), and an exponentially cutoff power-law proton spectrum (bottom). The X-ray flux upper limit obtained using Chandra (green), LAT spectral points (red), MAGIC points (violet) (Klepser et al. 2011), and H.E.S.S. points (blue) (Aharonian et al. 2008) are shown. The black line denotes the total synchrotron, inverse Compton and pion decay emission from the nebula.Thin curves indicate the Compton components from scattering on the CMB (long-dashed), IR (medium-dashed), and stellar (dotted) photons. |
Given that the size of the potential X-ray PWN is not known, we investigated an appropriately sized extraction region to see whether it contains statistically significant count excess above background. The extraction region is an annulus extending from 2′′–15′′ from the position of the pulsar. The inner radius was chosen to avoid contamination from the pulsar. The outer radius was chosen based on the X-ray PWNe observed for pulsars with comparable Ė by scaling their angular size with their distance (Kargaltsev & Pavlov 2008). The background regions were chosen from several other source-free regions near the pulsar. For the 2′′–15′′ extraction region we find an upper limit on the unabsorbed flux of 5 × 10-14 erg s-1 cm-2 (1–10 keV, 3σ confidence), corresponding to a luminosity of 5 × 1032 erg s-1. The counts in this region show a 2σ excess from zero counts. Assuming instead the TeV position and a 6′ extraction region consistent with the H.E.S.S. morphology, we find an upper limit on the unabsorbed flux of 2 × 10-12 erg s-1 cm-2 (1–10 keV, 3σ confidence), corresponding to a luminosity of 2 × 1034 erg s-1. Given the marginal significance of the count excesses derived, we cannot convincingly claim the detection of a weak X-ray PWN. These luminosity limits are derived from the 3σ upper bound on the net count rate and assume a typical power-law spectrum of index 1.5 for the PWN, a distance of 9 kpc, and a column density NH = 4 × 1022 cm-2 based on the spectroscopic analysis of the XMM data.
5. Discussion
The nature of HESS J1857+026 remains unclear. From the observations presented here, we know that the GeV source is positionally and spectrally consistent with the TeV source, suggesting a physical relationship. The limits on an X-ray PWN indicate a low magnetic field for any leptonic model, because a larger field would produce strong X-ray synchrotron emission. The spatial extent of the TeV source and the proximity to a pulsar suggests a PWN. The distance, characteristic age, and energy available from the pulsar are known, although any distance estimate based on DM has a significant uncertainty. Using these inputs, we investigate whether a plausible PWN model consistent with all the observations can be found.
To investigate the global properties of the PWN, we apply a one-zone time dependent spectral energy distribution (SED) model which reproduces the multi-wavelength measurements from MAGIC (Klepser et al. 2011), H.E.S.S. (Aharonian et al. 2008), as well as the LAT results and the 2′′–15′′ X-ray upper limit described above. This model is described in Grondin et al. (2011) and Abdo et al. (2010), with a more detailed description (applied to a multi-zone scenario rather than one-zone) found in Sect. 3.10 of Van Etten & Romani (2011).
The model computes SEDs from evolving electron populations over the lifetime of the pulsar in a series of time steps with the energy content of the injected particle population varying with time according to the pulsar spin down. At each time step, new particles are injected and synchrotron, inverse Compton, and adiabatic cooling is computed. Synchrotron and inverse Compton fluxes are computed from the final electron spectrum, magnetic field, and photon fields. Starting assumptions include: the source of all particles and magnetic field in the nebula is PSR J1856+0245, ambient photon fields are uniform and do not vary over the evolution time of the electron populations, and the nebula distance is 9 kpc.
The large size of the nebula (~20 pc at 9 kpc) implies a middle-aged PWN, whose parent SNR has likely evolved from the free-expansion phase to the Sedov phase. The Sedov phase is expected to occur on a timescale of tSedov ≈ 3 kyr for an explosion of 1051 erg, an ejecta mass of 10 M⊙, and an ambient medium density of 0.1 cm-3 (Truelove & McKee 1999). Eventually, the inward moving SNR reverse shock collides with the expanding PWN, which can happen as late as 5 times the transition to the Sedov phase (van der Swaluw et al. 2004). The interaction of the PWN and the SNR reverse shock compresses the PWN, resulting in an increased magnetic field. Even in the spherically symmetric case the evolution is complex, with the PWN undergoing a series of oscillations due to the reverse shock interaction. The significant offset of the pulsar from the γ-ray centroid implies either a PWN expansion into an inhomogenous medium, or an asymmetric reverse shock interaction. Either way, models such as Gelfand et al. (2009) which compute the PWN compression assuming spherical symmetry cannot be applied.
Given the lack of multi-wavelength data for HESS J1857+026 and the complexity of the SNR-PWN interaction, we see little reason to adopt a complicated spatial model and therefore assume a simple spatial evolution. During the free-expansion phase of the PWN (assumed to be ~3 kyr) we adopt an expansion of R ∝ t, following which the radius evolves as R ∝ t0.3, appropriate for a PWN expanding in pressure equilibrium with a Sedov phase SNR (Reynolds & Chevalier 1984). We also adopt a simple magnetic field model, and assume that over the pulsar lifetime the magnetic field evolves as B ∝ t-1.5, following ~500 years of constancy. This magnetic field evolution is similar to the t-1.3 − t-2 behavior derived by Reynolds & Chevalier (1984) and the t-1.7 evolution of Gelfand et al. (2009) during the initial expansion phase. The power-law evolution of the magnetic field is similar to that adopted by Zhang et al. (2008), Lemiere et al. (2009), Mayer et al. (2012) for similarly aged PWNe.
Model fitting is achieved by minimizing the χ2 between model and data using the downhill simplex method described in Press et al. (1992). For each ensemble of N variable parameters we evolve the system over the pulsar lifetime and calculate χ2 between model curves and flux data points. The simplex routine subsequently varies the parameters of interest to minimize the fit statistic. We estimate parameter errors by computing χ2 for a sampling of points near the best fit values and using these points to fit the N-dimensional ellipsoid describing the surface of Δχ2 = 2.71. Assuming that the adopted PWN model is correct, and that errors are Gaussian, the projected size of this Δχ2 = 2.71 ellipsoid onto each parameter axis defines the 90% multi-parameter (projected) error.
Model parameters: the leptonic fits, including the statistical uncertainties on the fitted parameters.
Model parameters: the hadronic fit, including the statistical uncertainties on the fitted parameters.
Using the radio pulsar ephemeris, we tried to derive a value for the braking index using Eq. (1) where ν, ν(i) and n represent respectively the rotational frequency of the pulsar, its time derivative of order i and the braking index  (1)We obtained n > 20. Large braking indices between glitches are common among Vela-like pulsars and are likely to be associated with glitch recoveries. These large values should not be interpreted as the long-term braking index due to secular spin evolution but instead these correspond to transient states caused by large glitch activity as discussed in Sect. 3.2.2 of Hobbs et al. (2010). Dipole braking indices have been measured only for a few pulsars with the highest spindown rates (see Table 1 of Espinoza et al. 2011).
With its characteristic age of ~21 kyr, PSR J1856+0245 is a Vela-like pulsar possibly affected by large glitch activity, which we have not yet directly seen. Thus, we fix here the pulsar braking index to the canonical value of 3.
We assume the existence of three primary photon fields (CMBR, far IR (dust), and starlight) and use the interstellar radiation field from GALPROP4 (Porter et al. 2005) to estimate the photon fields at the Galactic radius of PSR J1856 + 0245. A distance of 9 kpc in the direction of the pulsar corresponds to a Galactic radius of 5.4 kpc. At this radius, the peak of the SED of dust IR photons corresponds to a black-body temperature of T ~ 32 K with a density of ~1.1 eV cm-3, while the SED of stellar photons peaks at T ~ 2500 K with a density of ~1.2 eV cm-3.
A simple exponentially cutoff power-law injection of electrons, evolved properly over the pulsar lifetime, often provides an adequate match to PWN SEDs. For this injection spectrum we fit four variables: final magnetic field Bf, electron high energy cutoff Ecut, electron power-law index p, and initial pulsar spin period P0. The best fit parameters, with errors, are given in Table 2. The initial spin period gives an age of 20 ± 2 kyr. This model poorly matches the low energy MAGIC points, as shown in Fig. 2 (top). The low value of ~4 μG found for the magnetic field is consistent with 6 μG found for the 15 kyr old PWN HESS J1640–465 in Lemiere et al. (2009)
Another option to fit the multi-wavelength data is to adopt the relativistic Maxwellian plus power-law tail electron spectrum proposed by Spitkovsky (2008). We implement this spectrum as described in Grondin et al. (2011). The best fit, presented in Fig. 2 (middle) and Table 2, is obtained with kT = 0.64 TeV corresponding to an upstream Lorentz factor of 2.5 × 10⁶. A very high cutoff of 390 TeV is required, though the power-law index of p = 2.44 is consistent with the value of ~2.5 proposed by Spitkovsky (2008). The initial spin period gives an age of 15 ± 2 kyr. The relativistic Maxwellian plus power-law model better matches the multi-wavelength data, and also directly probes the upstream pulsar wind via fitting of the upstream Lorentz factor of the wind.
A hadronic scenario is also possible, with γ-rays arising from proton-proton interactions. For this model, corresponding to Fig. 2 (bottom) and Table 3, we fix the ambient gas density at 50 cm-3 and age at 20 kyr. It should be noted though that the total energy injected in such scenario is very high even for the large density assumed here.
6. Conclusions
Using 3 years of Fermi-LAT data, a γ-ray source has been detected at high significance at a position coincident with the TeV source HESS J1857+026. We have investigated whether a model in which a PWN is powered by the pulsar PSR J1856+0245 can reproduce the multi-wavelength data. In such a scenario, the VHE spectrum observed by MAGIC and H.E.S.S., combined with the limits imposed by the steep LAT data, is difficult to match with a simple power-law injection of electrons (or protons), and we find a significantly better fit with a relativistic Maxwellian plus power-law spectrum. The low magnetic field of these leptonic fits, due to the stringent X-ray upper limit, implies that if PWN leptons are indeed responsible for the γ-ray flux, they must be dominated by relic electrons which have escaped the PWN core into weakly magnetized surroundings. The hadronic scenario relaxes this constraint, though the energy requirements are quite high even for a dense ambient medium, and a very hard power-law index is required. At present the true nature of HESS J1857+026 remains a mystery, though the new LAT data and X-ray upper limit hint that this source may be another relic PWN, increasing the population of such high energy γ-ray systems.
Chandra Interactive Analysis of Observations (Fruscione et al. 2006).
Acknowledgments
The Fermi-LAT Collaboration acknowledges generous ongoing support from a number of agencies and institutes that have supported both the development and the operation of the LAT as well as scientific data analysis. These include the National Aeronautics and Space Administration and the Department of Energy in the United States, the Commissariat à l’Énergie Atomique and the Centre National de la Recherche Scientifique/Institut National de Physique Nucléaire et de Physique des Particules in France, the Agenzia Spaziale Italiana and the Istituto Nazionale di Fisica Nucleare in Italy, the Ministry of Education, Culture, Sports, Science and Technology (MEXT), High Energy Accelerator Research Organization (KEK) and Japan Aerospace Exploration Agency (JAXA) in Japan, and the K. A. Wallenberg Foundation, the Swedish Research Council and the Swedish National Space Board in Sweden. Additional support for science analysis during the operations phase is gratefully acknowledged from the Istituto Nazionale di Astrofisica in Italy and the Centre National d’Études Spatiales in France. The Lovell Telescope is owned and operated by the University of Manchester as part of the Jodrell Bank Centre for Astrophysics with support from the Science and Technology Facilities Council of the United Kingdom.
References
- Abdo, A. A., Ackermann, M., Ajello, M., et al. 2009a, ApJ, 696, 1084 [NASA ADS] [CrossRef] [Google Scholar]
- Abdo, A. A., Ackermann, M., Ajello, M., et al. 2009b, Phys. Rev. D, 80, 122004 [NASA ADS] [CrossRef] [Google Scholar]
- Abdo, A. A., Ackermann, M., Ajello, M., et al. 2010a, Science, 327, 1103 [NASA ADS] [CrossRef] [PubMed] [Google Scholar]
- Abdo, A. A., Ackermann, M., Ajello, M., et al. 2010b, ApJ, 722, 1303 [NASA ADS] [CrossRef] [Google Scholar]
- Abdo, A. A., Ackermann, M., Ajello, M., et al. 2010c, ApJS, 187, 460 [NASA ADS] [CrossRef] [Google Scholar]
- Abdo, A. A., Ackermann, M., Ajello, M., et al. 2010d, ApJ, 713, 146 [NASA ADS] [CrossRef] [Google Scholar]
- Ackermann, M., Ajello, M., Baldini, L., et al. 2011, ApJ, 726, 35 [NASA ADS] [CrossRef] [Google Scholar]
- Aharonian, F., Akhperjanian, A. G., Barres de Almeida, U., et al. 2008, A&A, 477, 353 [Google Scholar]
- Atwood, W. B., Abdo, A. A., Ackermann, M., et al. 2009, ApJ, 697, 2, 1071 [Google Scholar]
- Cordes, J. M., & Lazio, T. J. W. 2002 [arXiv:astro-ph/0207156] [Google Scholar]
- Espinoza, C. M., Lyne, A. G., Kramer, M., Manchester, R. N., & Kaspi, V. M. 2011, ApJ, 741, L13 [NASA ADS] [CrossRef] [Google Scholar]
- Fruscione, A., McDowell, J. C., Allen, G. E., et al. 2006, Proc. SPIE, 6270 [Google Scholar]
- Gaensler, B. M., & Slane, P. O. 2006, ARA&A, 44, 17 [NASA ADS] [CrossRef] [Google Scholar]
- Gelfand, J. D., Slane, P. O., & Zhang, W. 2009, ApJ, 703, 2051 [NASA ADS] [CrossRef] [Google Scholar]
- Grondin, M.-H., Funk, S., Lemoine-Goumard, M., et al. 2011, ApJ, 738, 42 [NASA ADS] [CrossRef] [Google Scholar]
- Hinton, J. A., & Hofmann, W. 2010, ARA&A, 47, 523 [Google Scholar]
- Hobbs, G., Lyne, A. G., Kramer, M., Martin, C. E., & Jordan, C. 2004, MNRAS, 353, 1311 [NASA ADS] [CrossRef] [Google Scholar]
- Hobbs, G., Edwards, R., & Manchester, R. 2006, Chin. J. A A, 6, 2, 189 [Google Scholar]
- Hobbs, G., Lyne, A. G., & Kramer, M. 2010, MNRAS, 402, 1022 [Google Scholar]
- Hessels, J. W. T., Nice, D. J., Gaensler, B. M., et al. 2008, ApJ, 682, L41 [Google Scholar]
- Kargaltsev, O., & Pavlov, G. G. 2008, AIP Conf. Proc., 983, 171 [Google Scholar]
- Kerr, M. 2011, Ph.D. Thesis, Univ. of Washington, Seattle, USA [arXiv:1101.6072v1] [Google Scholar]
- Klepser, S., Krause, J., & Michele, D. 2011, Proc. 32th International Cosmic Ray Conference [arXiv:1109.6448v1] [Google Scholar]
- Lemiere, A., Slane, P. O., Gaensler, B. M., & Murray, S. 2009, ApJ, 706, 1269 [NASA ADS] [CrossRef] [Google Scholar]
- Mattana, F., Falanga, M., Götz, D., et al. 2009, ApJ, 694, 12 [NASA ADS] [CrossRef] [Google Scholar]
- Mattox, J. R., Bertsch, D. L., Chiang, J., et al. 1996, ApJ, 461, 396 [NASA ADS] [CrossRef] [Google Scholar]
- Mayer, M., Brucker, J., Jung, I., Valerius, K., & Stegmann, C. 2012, A&A, submitted [arXiv:1202.1455] [Google Scholar]
- Neronov, A., & Semikoz, D. 2010 [arXiv:1011.0210v1] [Google Scholar]
- Nolan, P. L., Abdo, A. A., Ackermann, M., et al. 2012, ApJS, 199, 31 [NASA ADS] [CrossRef] [Google Scholar]
- Porter, T. A., & Strong, A. W. 2005, Proc. 29th International Cosmic Ray Conference, 4, 77 [Google Scholar]
- Press, W. H., Teukolsky, S. A., Vetterling, W. T., & Flannery, B. P. 1992, Numerical recipes in FORTRAN. The art of scientific computing (Cambridge: University Press), 2nd edn. [Google Scholar]
- Reynolds, S. P., & Chevalier, R. A. 1984, ApJ, 278, 630 [NASA ADS] [CrossRef] [Google Scholar]
- Romani, R. W., Kerr, M., Craig, H. A., et al. 2011, ApJ, 738, 114 [NASA ADS] [CrossRef] [Google Scholar]
- Slane, P. O., Castro, D., Funk, S., et al. 2010, ApJ, 720, 266 [NASA ADS] [CrossRef] [Google Scholar]
- Smith, D. A., Guillemot, L., Camilo, F., et al. 2008, A&A, 492, 923 [NASA ADS] [CrossRef] [EDP Sciences] [Google Scholar]
- Spitkovsky, A. 2008, ApJ, 682, L5 [NASA ADS] [CrossRef] [Google Scholar]
- Tanaka, S. J., & Takahara, F. 2011, ApJ, 741, 40 [NASA ADS] [CrossRef] [Google Scholar]
- Torres, D. F., Li, H., Chen, Y., et al. 2011, MNRAS, 417, 3072 [NASA ADS] [CrossRef] [Google Scholar]
- Truelove, J. K., & McKee, C. F. 1999, ApJS, 120, 299 [NASA ADS] [CrossRef] [Google Scholar]
- Van der Swaluw, E., Downes, T. P., & Keegan, R. 2004, A&A, 420, 937 [NASA ADS] [CrossRef] [EDP Sciences] [Google Scholar]
- Van Etten, A., & Romani, R. W. 2011, ApJ, 742, 62 [Google Scholar]
- Zhang, L., Chen, S. B., & Fang, J. 2008, ApJ, 676, 1210 [NASA ADS] [CrossRef] [Google Scholar]
All Tables
Model parameters: the leptonic fits, including the statistical uncertainties on the fitted parameters.
Model parameters: the hadronic fit, including the statistical uncertainties on the fitted parameters.
All Figures
|
Fig. 1 TS maps computed by pointlike. The green crosses show the sources of the 2FGL catalog included in the model, whereas the blue X represents the source we added to the model. The green contours show the H.E.S.S. data (Aharonian et al., 2008). The magenta circle gives the position of PSR J1856+0245. Top: TS map obtained between 10 and 300 GeV. The position of the Fermi-LAT excess is consistent with that of H.E.S.S. Note that HESS J1857+026 is not included in the model. Middle: TS map obtained between 0.1 and 1.3 GeV, showing the residual excess taken into account in our model. Bottom: residual TS map obtained between 10 and 300 GeV when all sources are included. |
| In the text | |
|
Fig. 2 Spectral energy distribution of HESS J1857 + 026 with a simple exponentially cutoff power-law electron spectrum (top), a relativistic Maxwellian plus power-law electron spectrum (middle), and an exponentially cutoff power-law proton spectrum (bottom). The X-ray flux upper limit obtained using Chandra (green), LAT spectral points (red), MAGIC points (violet) (Klepser et al. 2011), and H.E.S.S. points (blue) (Aharonian et al. 2008) are shown. The black line denotes the total synchrotron, inverse Compton and pion decay emission from the nebula.Thin curves indicate the Compton components from scattering on the CMB (long-dashed), IR (medium-dashed), and stellar (dotted) photons. |
| In the text | |
Current usage metrics show cumulative count of Article Views (full-text article views including HTML views, PDF and ePub downloads, according to the available data) and Abstracts Views on Vision4Press platform.
Data correspond to usage on the plateform after 2015. The current usage metrics is available 48-96 hours after online publication and is updated daily on week days.
Initial download of the metrics may take a while.