Fig. 2
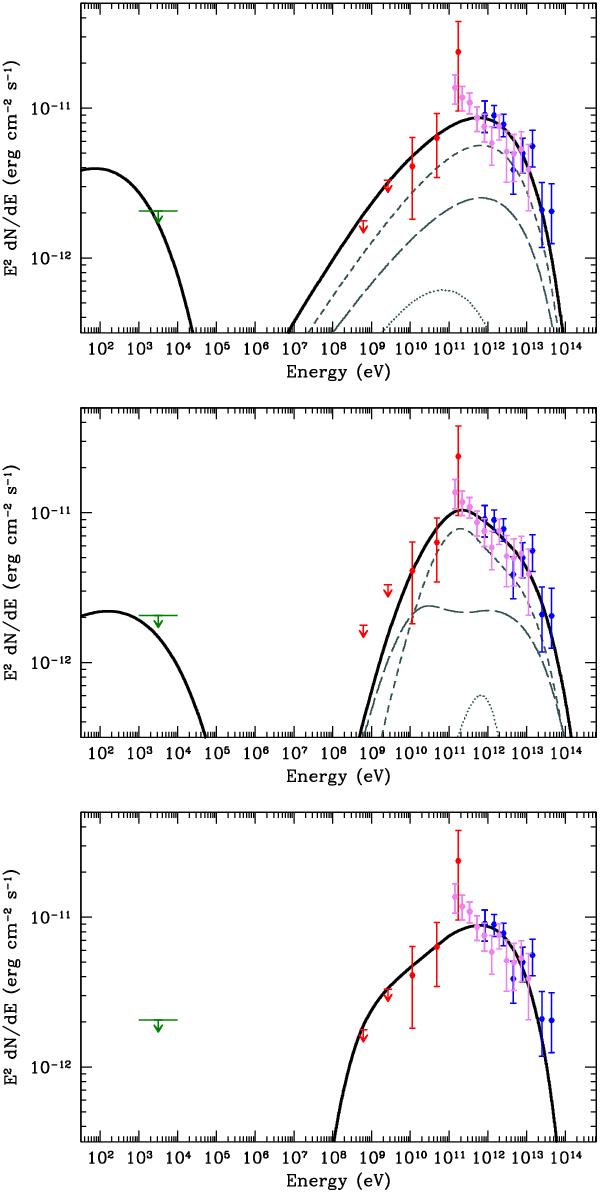
Spectral energy distribution of HESS J1857 + 026 with a simple exponentially cutoff power-law electron spectrum (top), a relativistic Maxwellian plus power-law electron spectrum (middle), and an exponentially cutoff power-law proton spectrum (bottom). The X-ray flux upper limit obtained using Chandra (green), LAT spectral points (red), MAGIC points (violet) (Klepser et al. 2011), and H.E.S.S. points (blue) (Aharonian et al. 2008) are shown. The black line denotes the total synchrotron, inverse Compton and pion decay emission from the nebula.Thin curves indicate the Compton components from scattering on the CMB (long-dashed), IR (medium-dashed), and stellar (dotted) photons.
Current usage metrics show cumulative count of Article Views (full-text article views including HTML views, PDF and ePub downloads, according to the available data) and Abstracts Views on Vision4Press platform.
Data correspond to usage on the plateform after 2015. The current usage metrics is available 48-96 hours after online publication and is updated daily on week days.
Initial download of the metrics may take a while.