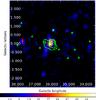
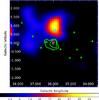
Fig. 1
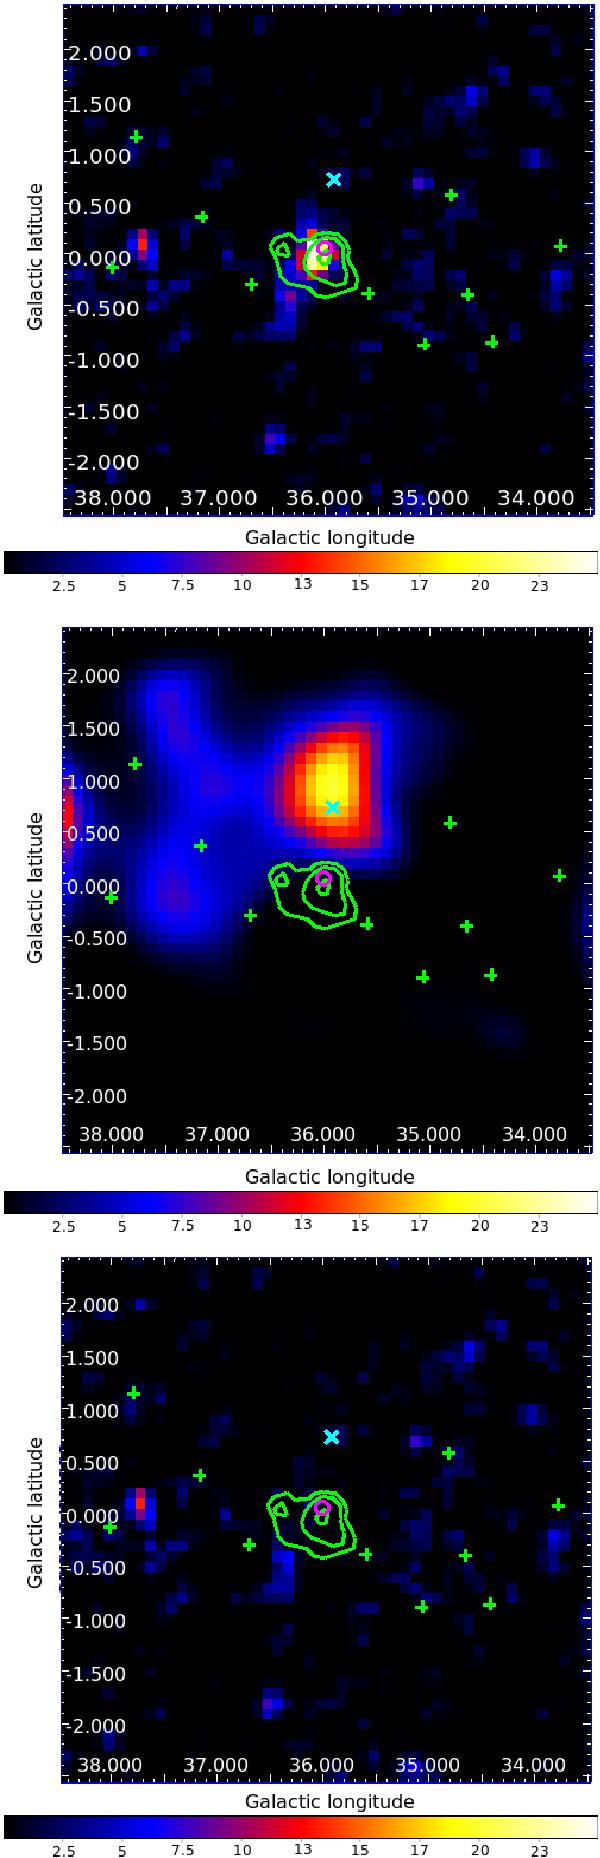
TS maps computed by pointlike. The green crosses show the sources of the 2FGL catalog included in the model, whereas the blue X represents the source we added to the model. The green contours show the H.E.S.S. data (Aharonian et al., 2008). The magenta circle gives the position of PSR J1856+0245. Top: TS map obtained between 10 and 300 GeV. The position of the Fermi-LAT excess is consistent with that of H.E.S.S. Note that HESS J1857+026 is not included in the model. Middle: TS map obtained between 0.1 and 1.3 GeV, showing the residual excess taken into account in our model. Bottom: residual TS map obtained between 10 and 300 GeV when all sources are included.
Current usage metrics show cumulative count of Article Views (full-text article views including HTML views, PDF and ePub downloads, according to the available data) and Abstracts Views on Vision4Press platform.
Data correspond to usage on the plateform after 2015. The current usage metrics is available 48-96 hours after online publication and is updated daily on week days.
Initial download of the metrics may take a while.