Fig. 3
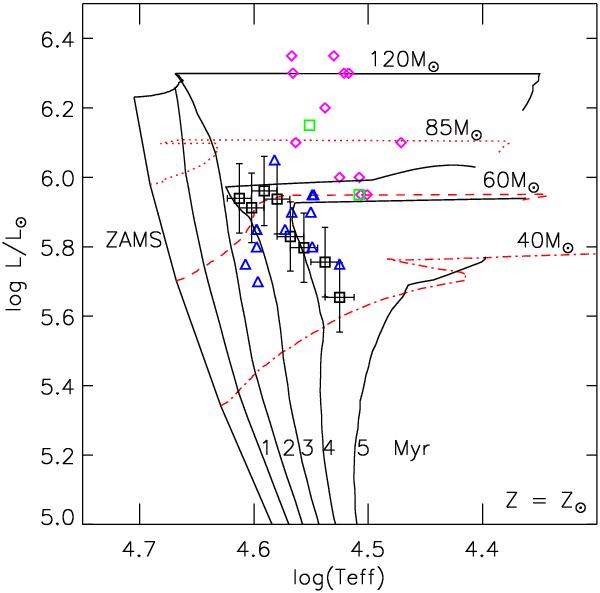
H-R diagram showing the program stars (black squares) and the stars from Martins et al. (2008) for comparison. Blue triangles are “normal” O4-6 supergiants, green squares are “extreme” O4-6If+ stars, pink diamonds are WN7-9h objects. Evolutionary tracks and isochrones are from Meynet & Maeder (2003) with an initial rotation of 300 km s-1.
Current usage metrics show cumulative count of Article Views (full-text article views including HTML views, PDF and ePub downloads, according to the available data) and Abstracts Views on Vision4Press platform.
Data correspond to usage on the plateform after 2015. The current usage metrics is available 48-96 hours after online publication and is updated daily on week days.
Initial download of the metrics may take a while.