Fig. 22
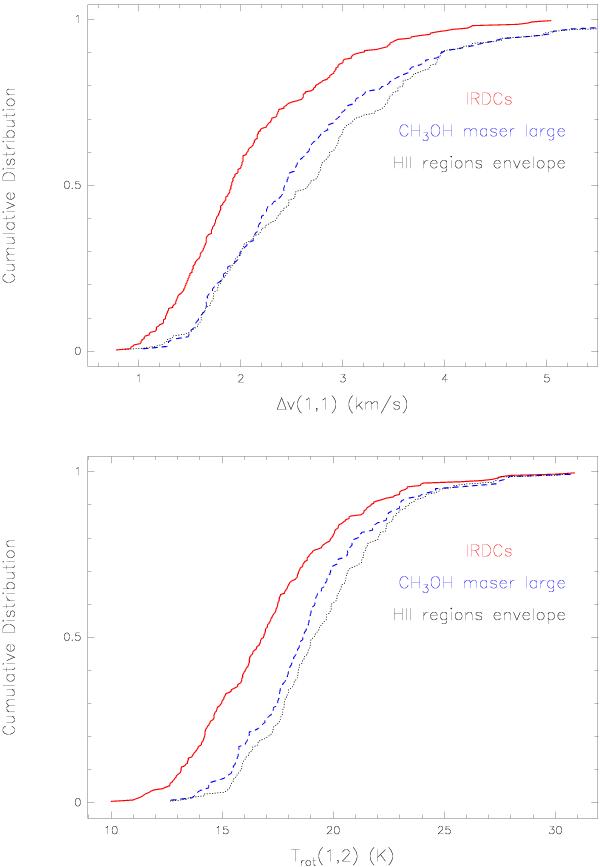
Cumulative distribution functions illustrating the NH3 (1, 1) linewidth (upper panel) and rotational temperature (lower panel) for the three largest subsamples in Table 6. The distribution of IRDCs from Peretto & Fuller (2009) is shown as a solid red line, the CH3OH sample found within the large search radius is plotted as a dashed blue curve and the H II regions envelope as a dotted black curve.
Current usage metrics show cumulative count of Article Views (full-text article views including HTML views, PDF and ePub downloads, according to the available data) and Abstracts Views on Vision4Press platform.
Data correspond to usage on the plateform after 2015. The current usage metrics is available 48-96 hours after online publication and is updated daily on week days.
Initial download of the metrics may take a while.