Fig. 7
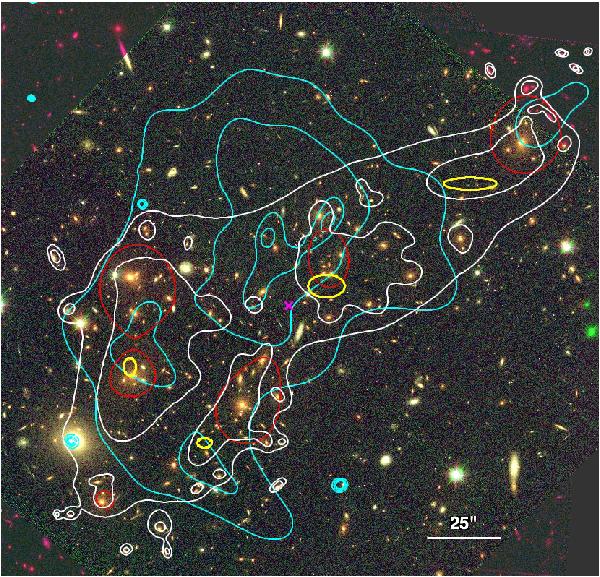
Peaks of the light distribution (red contours), mass map (white contours, corresponding to a density equal to 5 and 7 × 10¹⁰ M⊙ arcsec-2) and X-ray surface brightness map (cyan contours). The magenta cross shows the barycentre of the Einstein ring as estimated by Meneghetti et al. (2011). The locations and positional uncertainties (1σ) of the four large-scale mass components are indicated by the yellow ellipses.
Current usage metrics show cumulative count of Article Views (full-text article views including HTML views, PDF and ePub downloads, according to the available data) and Abstracts Views on Vision4Press platform.
Data correspond to usage on the plateform after 2015. The current usage metrics is available 48-96 hours after online publication and is updated daily on week days.
Initial download of the metrics may take a while.