Fig. 6
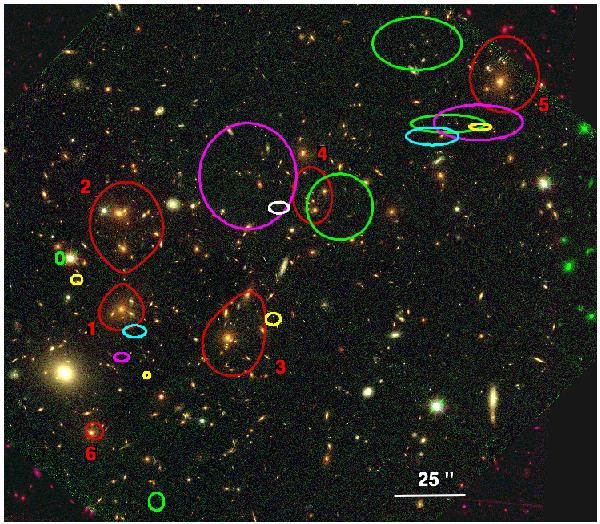
Results from the blind tests. Peaks of the light distribution are drawn by red contours, labelled from 1 to 6. For each blind test, we report the location of each mass component by an ellipse whose semi-axis length corresponds to the errors on its location (at the 1σ confidence level). White, cyan, magenta, yellow and green ellipses correspond to the one-, two-, three-, four- and five-component mass models respectively.
Current usage metrics show cumulative count of Article Views (full-text article views including HTML views, PDF and ePub downloads, according to the available data) and Abstracts Views on Vision4Press platform.
Data correspond to usage on the plateform after 2015. The current usage metrics is available 48-96 hours after online publication and is updated daily on week days.
Initial download of the metrics may take a while.