Fig. 1
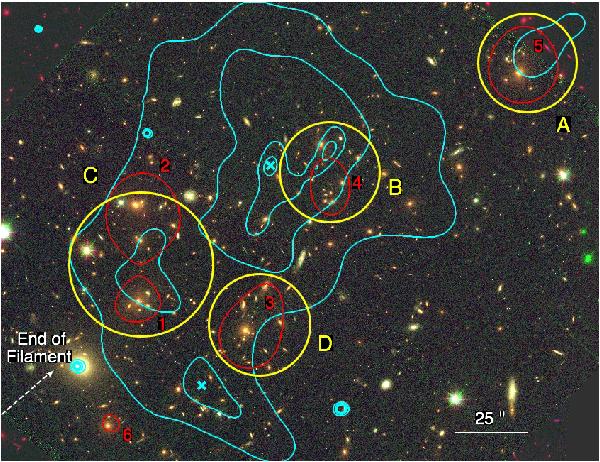
HST/ACS image of MACS J0717 using the F555W, F606W, and F814W passbands. Peaks of the light distribution (red contours) and X-ray surface-brightness map (cyan contours) are shown. The cyan crosses are peaks in the surface-brightness distribution that exhibit cooler temperatures than their surroundings, making them likely candidates for the cool cores of sub-clusters merging with the main system. The yellow circles centred on the four main peaks in the cluster light distribution mark the regions within which average radial velocities and velocity dispersions were computed by Ma et al. (2009). The white dashed arrow at the south-east corner of the image indicates the orientation of the large-scale filament.
Current usage metrics show cumulative count of Article Views (full-text article views including HTML views, PDF and ePub downloads, according to the available data) and Abstracts Views on Vision4Press platform.
Data correspond to usage on the plateform after 2015. The current usage metrics is available 48-96 hours after online publication and is updated daily on week days.
Initial download of the metrics may take a while.