| Issue |
A&A
Volume 543, July 2012
|
|
|---|---|---|
| Article Number | A132 | |
| Number of page(s) | 3 | |
| Section | Extragalactic astronomy | |
| DOI | https://doi.org/10.1051/0004-6361/201219443 | |
| Published online | 11 July 2012 | |
Research Note
Are passive red spirals truly passive?
The current star formation activity of optically red disc galaxies
European Southern Observatory,
Karl-Schwarzschild-Str. 2,
85748
Garching bei München,
Germany
e-mail: This email address is being protected from spambots. You need JavaScript enabled to view it.
Received: 19 April 2012
Accepted: 30 May 2012
Abstract
We used GALEX ultraviolet and WISE 22 μm observations to investigate the current star formation activity of the optically red spirals recently identified as part of the Galaxy Zoo project. These galaxies were accurately selected from the Sloan Digital Sky Survey as pure discs with low or no current star formation activity, representing one of the best optically selected samples of candidate passive spirals. However, we show that these galaxies are not only still forming stars at a significant rate (≳1 M⊙ yr-1) but, more importantly, their star formation activity is not different from that of normal star-forming discs of the same stellar mass (M∗ ≳ 1010.2 M⊙). Indeed, these systems lie on the UV-optical blue sequence, even without any corrections for internal dust attenuation, and they follow the same specific star formation rate vs. stellar mass relation of star-forming galaxies. Our findings clearly show that at high stellar masses, optical colours do not allow to distinguish between actively star-forming and truly quiescent systems.
Key words: galaxies: evolution / galaxies: photometry / galaxies: star formation / ultraviolet: galaxies / infrared: galaxies
© ESO, 2012
1. Introduction
Since its discovery, the colour vs. magnitude (or stellar mass) relation (e.g., Visvanathan & Sandage 1977; Visvanathan 1981) has been adopted as one of the most useful tools for characterizing the properties of galaxies across the Hubble time. Particularly powerful is the use of colours to distinguish between late-type/star-forming systems and early-type/passive galaxies, when accurate morphological classification is not available. However, it is now well known that the bimodality in the colour distribution of galaxies does not always reflect a difference in morphological type (Scodeggio et al. 2002; Franzetti et al. 2007). Indeed, at least in the local Universe, blue/star-forming spheroids (e.g., Yi et al. 2005; Kannappan et al. 2009; Schawinski et al. 2009) and red/quiescent spirals (e.g., van den Bergh 1976; Moran et al. 2006; Crowl & Kenney 2008; Cortese & Hughes 2009; Wolf et al. 2009; Bundy et al. 2010; Rowlands et al. 2012) do exist.
In the last decade, we have seen a rapid increase in the number of studies focused on these unusual systems with the aim of understanding why they do not follow the typical relations between morphology and colours. However, while identifying current star formation activity in elliptical galaxies is relatively easy, isolating truly quiescent disc galaxies is a more complicated problem. Indeed, optical red colours do not always automatically imply a passive stellar population (e.g., Cowie & Barger 2008; Cortese & Hughes 2009). Dust extinction and a large bulge component are among some of the problems that can significantly affect the observed optical colours of discs, making them appear much more “evolved” than they really are. For these reasons, the vast majority of the works focused on truly passive spirals have taken advantage of multiwavelength datasets spanning from the ultraviolet to the mid- and far-infrared regime to account at least for the effects of internal dust absorption (e.g., Wolf et al. 2009; Gallazzi et al. 2009).
Recently, as part of the Galaxy Zoo project (Lintott et al. 2008), Masters et al. (2010, hereafer M10) performed a careful selection to isolate and study red spirals. These authors took advantage of the morphological classification available for thousands of objects to select spiral galaxies and then adopted a simple cut in inclination, optical colour, and bulge fraction to identify disc-dominated objects that should be “truly passive” (i.e. with current star formation activity significantly lower than what is observed in normal spiral galaxies of similar stellar mass). The novelty of this technique lies in the fact that only optical data, combined with an accurate morphological classification, are needed to isolate the red spiral population. If successful, these selection criteria may significantly facilitate isolating passive systems, thus improving our understanding of the evolutionary paths leading to these unusual galaxies.
Thus, in this Research Note we take advantage of GALaxy Evolution eXplorer (GALEX, Martin et al. 2005) ultraviolet (UV) and Wide-field Infrared Survey Explorer (WISE, Wright et al. 2010) 22 μm observations to study the star formation properties of these optically red spiral galaxies and to determine whether they really are passive.
2. The data
The sample of optically red spirals presented by M10 comes from the Galaxy Zoo clean catalogue (Lintott et al. 2008), which is based on the Sloan Digital Sky Survey (SDSS) DR6 (Adelman-McCarthy et al. 2008). First, a volume-limited sample of spirals was obtained assuming spiral likelihood1 (Bamford et al. 2009) greater than 0.8, spectroscopic redshift 0.03 < z < 0.085 and r-band absolute magnitude Mr < −20.17 mag. Secondly, bulge-less and face-on discs were selected requiring a ratio between the major and minor axis of the galaxy log (a/b) < 0.2 and a fraction of the light coming from the de Vaucouleur component of the surface brightness profile fracDev < 0.5. Finally, red spirals were defined as objects with a colour (g − r) > 0.63−0.02 × (Mr + 20). The sample of red spirals so obtained includes 294 galaxies.
Unfortunately, not all galaxies in the M10 sample are included in the GALEX GR6 public release. Thus, in the following analysis, we only focus on the subset of 255 galaxies observed by GALEX and lying within 0.55° from the centre of a GALEX tile to avoid edge effects2. Given that this subset includes ~87% of the original sample, we are confident that our conclusions can be extended to the whole population of optically red galaxies studied by M10.
2.1. GALEX and WISE photometry
We cross-correlated the 255 red spirals with the WISE all-sky survey source catalogue using a matching radius of 10 arcsec. We found 233 galaxies detected at 22 μm but, after a careful visual inspection of the images, 46 turned out to be spurious or marginal detections, or in regions highly contaminated by foreground emission. Thus, out of the 255 galaxies in our sample, 166 (~65%) are clearly detected at 22 μm.
To obtain homogeneous flux density estimates in the GALEX UV and WISE 22 μm bands, we performed aperture photometry using the same aperture size in all images. We adopted circular apertures of size twice the isophotal diameter at the 25 mag arcsec-2 level in r band, convolved to the WISE 22 μm resolution (12 arcsec). In a few cases, the size of the aperture has been adjusted to make sure that the entire emission from the galaxy is included. Sky background was determined in circular annuli or boxes around the target, and foreground/background objects were accurately masked.
All 255 galaxies in our sample are detected in near-ultraviolet (NUV), while only for 220 objects (86% of the sample) we were able to obtain a far-ultraviolet (FUV) flux density. This is mainly because the FUV observations are in general less sensitive than the NUV ones. By comparing the magnitudes obtained from independent observations of the same galaxy, as well as with the GALEX GR6 public catalogue, we obtain a typical uncertainty of ~0.15 and 0.30 mag in NUV and FUV, respectively. Similarly, we find a very good agreement between our flux densities and the standard aperture estimates (w4mag) in the WISE all-sky survey catalogue, with a typical scatter of ~0.2 mag.
UV magnitudes have been corrected for Galactic extinction following Wyder et al. (2007). No aperture or colour corrections were applied to the 22 μm flux densities. These are in general lower than the uncertainty on the flux density, and thus do not affect our results.
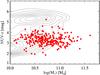 |
Fig. 1 Optically red spirals (red circles) on a NUV − r vs. stellar mass diagram. The contours show the distribution of galaxies in the GASS survey (Catinella et al. 2010). |
3. Results
Figure 1 shows where the red spirals (red filled circles) lie in an NUV − r colour vs. stellar mass (M∗) diagram. Stellar masses are taken from the MPA/JHU SDSS DR7 release3. These are derived from SDSS photometry using the spectral energy distribution fitting technique described in Salim et al. (2007), assuming a Chabrier (2003) initial mass function (IMF). The black contours show the colour distribution of the parent sample of the GALEX Arecibo SDSS survey (GASS, Catinella et al. 2010), a volume-limited sample of nearby massive galaxies (M∗ > 1010 M⊙), providing an indication of the typical range of UV colours of red- and blue-sequence massive galaxies in the local Universe.
Clearly, the red spirals in M10 sample are not quiescent. Not only is there just one galaxy in the UV red sequence, but almost the whole sample (94%, i.e., 240 out of the 255 galaxies) has an observed NUV − r colour bluer than 4 mag, i.e., the typical value observed in actively star-forming galaxies (e.g., Salim et al. 2007).
To determine if the current star formation activity of these optically red spirals is different from that of normal star-forming galaxies of similar stellar mass, we determined star formation rates (SFRs) by combining the GALEX UV and WISE 22 μm data. We used the 22 μm fluxes to correct the NUV and FUV luminosities for dust attenuation following Hao et al. (2011): 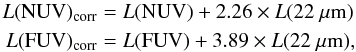 (1)where L are luminosities in units of erg s-1. It is important to note that these relations were calibrated using Spitzer 24 μm and IRAS 25 μm flux densities, whereas in this case we are applying them to the WISE 22 μm emission. Because for typical star-forming objects the 22 μm emission should be comparable to, or slightly fainter than, the 24 μm flux density, we can assume our corrections to be a lower limit to the real value. For galaxies observed but not detected by WISE we considered two different extreme cases by either fixing the 22 μm emission to zero or to the typical 3σ sensitivity limit of WISE (i.e. 3 mJy). We then estimated the current SFR from the corrected UV luminosities using the relation presented by Salim et al. (2007) that was calibrated on a Chabrier (2003) IMF
 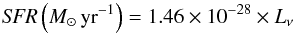 (2)where Lν is in units of erg s-1 Hz-1. The SFRs estimated from the NUV and FUV luminosities agree within ~10−25%, with the NUV-based SFR being typically higher by ~0.03−0.07 dex.
 |
Fig. 2 NUV- (top) and FUV-based (bottom) specific star formation rate vs. stellar mass relation for the sample of optically red spirals. Filled and empty circles show 22 μm detections and non-detections, respectively. For non-detections, the SFR has been determined by assuming a 22 μm flux density equal to zero (left panels) or to 3 mJy (i.e., ~3σ WISE detection limit; right panels). The dotted and solid lines show the best fit to the star-forming sequence obtained by Salim et al. (2007) by including only star-forming galaxies (i.e., excluding galaxies with optical lines ratios typical of active galactic nuclei) or all galaxies with NUV − r colour lower than 4, respectively. |
In Fig. 2 we plot the specific star formation rate (SSFR = SFR/M∗) as a function of the stellar mass for the M10 sample. The top and bottom panels show the results obtained for the NUV-based and FUV-based star formation rates, respectively. For each row, the difference between the left and right panels is in the treatment of the WISE non detections. While in the left panels the 22 μm flux density is set to zero, in the right ones it is equal to the typical 3σ noise level of WISE images. Thus, the two panels show the two extremes, with the real relation followed by this sample lying in between the two plots.
As expected from what we already showed in Fig. 1, and regardless of the way we treat non-detections, all red spirals are forming stars at a significant rate and ~85−90% (depending on which SFR estimate is used) have a current SFR ≥ 1 M⊙ yr-1. More importantly, the M10 sample follows the relation obtained for nearby star-forming galaxies by Salim et al. (2007, solid and dashed lines in Fig. 2 remarkably well, implying that these galaxies are not different from the local population of blue sequence discs.
4. Discussion and conclusion
The results presented in the previous section clearly show that the red spirals in the M10 sample are not passive but are still forming stars at the rate expected for their stellar mass. It is thus important to briefly discuss why the very careful optical selection performed by M10 did not isolate truly quiescent systems.
We can safely exclude that dust attenuation plays a dominant role. The selection of face-on spirals guarantees the absence of highly obscured systems, as clearly shown in Fig. 1. Indeed, dust extinction would much more heavily affect the UV colours and move all galaxies to the UV red sequence, contrary to what is observed.
To understand why these objects have optically red colours despite their still on-going star formation activity, it is important to remember that they are massive galaxies. For stellar masses ≳1010 M⊙, the optical blue cloud merges into the red sequence, suggesting that optical colours are no longer a good proxy for the current star formation activity of a galaxy. Indeed, as extensively discussed by Wyder et al. (2007), in the UV the blue and red sequences are well separated even at high luminosities, implying that massive spirals are forming stars despite what is suggested by their optical colours. This is, at least partially, a consequence of the fact that massive objects formed the bulk of their stars at earlier epochs than dwarf galaxies (e.g., Boselli et al. 2001; Gavazzi et al. 2002; Heavens et al. 2004; Thomas et al. 2010), and that optical colours are more directly related to the average age of the stellar populations than to the current star formation activity (e.g., Wyder et al. 2007; Chilingarian & Zolotukhin 2012). The fact that the fraction of the optically red spirals in the M10 sample significantly increases with stellar mass (see Fig. 2 of M10) is consistent with this scenario.
In conclusion, at least at high stellar masses, optical colours alone are not sufficient to distinguish between actively star-forming and quiescent systems.
This corresponds to the fractional number of cases in which a galaxy has been classified as a spiral by the public.
Only seven galaxies in the sample have been observed but lie at distances greater than 0.55°.
Acknowledgments
I wish to thank Daniel Thomas for encouraging me to publish this study and for useful comments, and Barbara Catinella for providing the data from the GASS survey. GALEX (Galaxy Evolution Explorer) is a NASA Small Explorer, launched in April 2003. We gratefully acknowledge NASA’s support for construction, operation, and science analysis for the GALEX mission, developed in cooperation with the Centre National d’Études Spatiales (CNES) of France and the Korean Ministry of Science and Technology. This publication makes use of data products from the Wide-field Infrared Survey Explorer, which is a joint project of the University of California, Los Angeles, and the Jet Propulsion Laboratory/California Institute of Technology, funded by the National Aeronautics and Space Administration. The research leading to these results has received funding from the European Community’s Seventh Framework Programme (/FP7/2007-2013/) under grant agreement No. 229517.
References
- Adelman-McCarthy, J. K., Agüeros, M. A., Allam, S. S., et al. 2008, ApJS, 175, 297 [NASA ADS] [CrossRef] [Google Scholar]
- Bamford, S. P., Nichol, R. C., Baldry, I. K., et al. 2009, MNRAS, 393, 1324 [NASA ADS] [CrossRef] [Google Scholar]
- Boselli, A., Gavazzi, G., Donas, J., & Scodeggio, M. 2001, AJ, 121, 753 [NASA ADS] [CrossRef] [Google Scholar]
- Bundy, K., Scarlata, C., Carollo, C. M., et al. 2010, ApJ, 719, 1969 [NASA ADS] [CrossRef] [Google Scholar]
- Catinella, B., Schiminovich, D., Kauffmann, G., et al. 2010, MNRAS, 403, 683 [NASA ADS] [CrossRef] [Google Scholar]
- Chabrier, G. 2003, PASP, 115, 763 [NASA ADS] [CrossRef] [Google Scholar]
- Chilingarian, I. V., & Zolotukhin, I. Y. 2012, MNRAS, 419, 1727 [NASA ADS] [CrossRef] [Google Scholar]
- Cortese, L., & Hughes, T. M. 2009, MNRAS, 400, 1225 [NASA ADS] [CrossRef] [Google Scholar]
- Cowie, L. L., & Barger, A. J. 2008, ApJ, 686, 72 [NASA ADS] [CrossRef] [Google Scholar]
- Crowl, H. H., & Kenney, J. D. P. 2008, AJ, 136, 1623 [NASA ADS] [CrossRef] [Google Scholar]
- Franzetti, P., Scodeggio, M., Garilli, B., et al. 2007, A&A, 465, 711 [NASA ADS] [CrossRef] [EDP Sciences] [Google Scholar]
- Gallazzi, A., Bell, E. F., Wolf, C., et al. 2009, ApJ, 690, 1883 [NASA ADS] [CrossRef] [Google Scholar]
- Gavazzi, G., Bonfanti, C., Sanvito, G., Boselli, A., & Scodeggio, M. 2002, ApJ, 576, 135 [NASA ADS] [CrossRef] [Google Scholar]
- Hao, C.-N., Kennicutt, R. C., Johnson, B. D., et al. 2011, ApJ, 741, 124 [NASA ADS] [CrossRef] [Google Scholar]
- Heavens, A., Panter, B., Jimenez, R., & Dunlop, J. 2004, Nature, 428, 625 [NASA ADS] [CrossRef] [PubMed] [Google Scholar]
- Kannappan, S. J., Guie, J. M., & Baker, A. J. 2009, AJ, 138, 579 [NASA ADS] [CrossRef] [Google Scholar]
- Lintott, C. J., Schawinski, K., Slosar, A., et al. 2008, MNRAS, 389, 1179 [NASA ADS] [CrossRef] [Google Scholar]
- Martin, D. C., Fanson, J., Schiminovich, D., et al. 2005, ApJ, 619, L1 [Google Scholar]
- Masters, K. L., Mosleh, M., Romer, A. K., et al. 2010, MNRAS, 405, 783 [NASA ADS] [Google Scholar]
- Moran, S. M., Ellis, R. S., Treu, T., et al. 2006, ApJ, 641, L97 [NASA ADS] [CrossRef] [Google Scholar]
- Rowlands, K., Dunne, L., Maddox, S., et al. 2012, MNRAS, 419, 2545 [NASA ADS] [CrossRef] [Google Scholar]
- Salim, S., Rich, R. M., Charlot, S., et al. 2007, ApJS, 173, 267 [NASA ADS] [CrossRef] [Google Scholar]
- Schawinski, K., Lintott, C., Thomas, D., et al. 2009, MNRAS, 396, 818 [NASA ADS] [CrossRef] [Google Scholar]
- Scodeggio, M., Gavazzi, G., Franzetti, P., et al. 2002, A&A, 384, 812 [NASA ADS] [CrossRef] [EDP Sciences] [Google Scholar]
- Thomas, D., Maraston, C., Schawinski, K., Sarzi, M., & Silk, J. 2010, MNRAS, 404, 1775 [NASA ADS] [Google Scholar]
- van den Bergh, S. 1976, ApJ, 206, 883 [NASA ADS] [CrossRef] [Google Scholar]
- Visvanathan, N. 1981, A&A, 100, L20 [NASA ADS] [Google Scholar]
- Visvanathan, N., & Sandage, A. 1977, ApJ, 216, 214 [NASA ADS] [CrossRef] [Google Scholar]
- Wolf, C., Aragón-Salamanca, A., Balogh, M., et al. 2009, MNRAS, 393, 1302 [NASA ADS] [CrossRef] [Google Scholar]
- Wright, E. L., Eisenhardt, P. R. M., Mainzer, A. K., et al. 2010, AJ, 140, 1868 [NASA ADS] [CrossRef] [Google Scholar]
- Wyder, T. K., Martin, D. C., Schiminovich, D., et al. 2007, ApJS, 173, 293 [NASA ADS] [CrossRef] [Google Scholar]
- Yi, S. K., Yoon, S.-J., Kaviraj, S., et al. 2005, ApJ, 619, L111 [NASA ADS] [CrossRef] [Google Scholar]
All Figures
|
Fig. 1 Optically red spirals (red circles) on a NUV − r vs. stellar mass diagram. The contours show the distribution of galaxies in the GASS survey (Catinella et al. 2010). |
| In the text | |
|
Fig. 2 NUV- (top) and FUV-based (bottom) specific star formation rate vs. stellar mass relation for the sample of optically red spirals. Filled and empty circles show 22 μm detections and non-detections, respectively. For non-detections, the SFR has been determined by assuming a 22 μm flux density equal to zero (left panels) or to 3 mJy (i.e., ~3σ WISE detection limit; right panels). The dotted and solid lines show the best fit to the star-forming sequence obtained by Salim et al. (2007) by including only star-forming galaxies (i.e., excluding galaxies with optical lines ratios typical of active galactic nuclei) or all galaxies with NUV − r colour lower than 4, respectively. |
| In the text | |
Current usage metrics show cumulative count of Article Views (full-text article views including HTML views, PDF and ePub downloads, according to the available data) and Abstracts Views on Vision4Press platform.
Data correspond to usage on the plateform after 2015. The current usage metrics is available 48-96 hours after online publication and is updated daily on week days.
Initial download of the metrics may take a while.