| Issue |
A&A
Volume 543, July 2012
|
|
|---|---|---|
| Article Number | A155 | |
| Number of page(s) | 11 | |
| Section | Interstellar and circumstellar matter | |
| DOI | https://doi.org/10.1051/0004-6361/201219390 | |
| Published online | 13 July 2012 | |
Nitrogen oxides and carbon chain oxides formed after ion irradiation of CO:N2 ice mixtures
1 INAF – Osservatorio Astrofisico di Catania, via Santa Sofia 78, 95123 Catania, Italy
e-mail: mepalumbo@oact.inaf.it
2 Raymond and Beverly Sackler Laboratory for Astrophysics, Leiden Observatory, Leiden University, PO Box 9513, 2300 RA Leiden, The Netherlands
Received: 11 April 2012
Accepted: 29 May 2012
Context. High CO depletion as well as depletion of N-bearing species is observed in dense pre-stellar cores. It is generally accepted that depleted species freeze out onto dust grains to form icy mantles and that these ices suffer energetic processing due to cosmic ion irradiation and ion-induced UV photons.
Aims. The aim of this work is to study the chemical and structural effects induced by ion irradiation on different CO:N2 mixtures at low temperature (16 K) to simulate the effects of cosmic ion irradiation of icy mantles.
Methods. Different CO:N2 mixtures and pure CO and pure N2 were irradiated with 200 keV H+ at 16 K. Infrared transmittance spectra of the samples were obtained in situ before and after irradiation. The samples were warmed up and spectra were taken at different temperatures. The residues left over on the substrate at room temperature were analysed ex situ by micro Raman spectroscopy.
Results. Several new absorption features are present in the infrared spectra after irradiation, indicating that new species are formed. The most abundant are nitrogen oxides (such as NO, NO2 and N2O), carbon chain oxides (such as C2O, C3O and C3O2), carbon chains (such as C3 and C6), O3 and N3. A refractory residue is also formed after ion irradiation and is clearly detected by Raman spectroscopy.
Conclusions. We suggest that carbon chains and nitrogen oxides observed in the gas phase towards star-forming regions are formed in the solid phase after cosmic ion irradiation of icy grain mantles and are released into the gas phase after desorption of grain mantles. We expect that the Atacama Large Millimeter/submillimeter Array (ALMA), thanks to its high sensitivity and resolution, will increase the number of nitrogen oxides and carbon chain oxides detected towards star-forming regions.
Key words: astrochemistry / methods: laboratory / techniques: spectroscopic / ISM: molecules / ISM: abundances / molecular processes
© ESO, 2012
1. Introduction
Observations show that gas-phase molecular depletion takes place in dense molecular clouds (e.g., Caselli et al. 1999; Tafalla et al. 2004; 2006; Brady Ford & Shirley 2011). Depletion increases with gas density and is a selective process. Species like CO and CS show a very strong abundance drop at densities of (2 − 6) × 104 cm-3 while other species, such as H2 and N2, are least affected by the depletion process. Homonuclear molecules, such as N2, cannot be directly observed while their chemical daughter products, like NH3 and N2H+, can be easily observed. N2H+ seems unaffected by the depletion process up to densities of about 106 cm-3 (e.g. Caselli et al. 2002; Bergin et al. 2002).
It is generally accepted that depleted species freeze out onto dust grains to form icy mantles that then suffer energetic processing due to cosmic ion irradiation and ion-induced UV photons (e.g. Jenniskens et al. 1993; Palumbo & Strazzulla 1993; Westley et al. 1993; Ioppolo et al. 2009).
Icy grain mantles have been observed towards high-mass and low-mass young stellar objects as well as quiescent molecular clouds (e.g. Tielens et al. 1991; Chiar et al. 1994; 1995; Teixeira et al. 1998; Whittet et al. 1998; Gibb et al. 2004; Boogert et al. 2008; Pontoppidan et al. 2008; Öberg et al. 2008; Bottinelli et al. 2010). Water (H2O), carbon monoxide (CO), methanol (CH3OH), methane (CH4), carbonyl sulfide (OCS), and carbon dioxide (CO2) are some of the most abundant molecular species detected in the interstellar medium in solid phase (e.g., Gibb et al. 2004). Some of the observed molecules freeze out from the gas phase (such as CO and N2), others (such as H2O, CH3OH, CO2 and OCS) form on grains. Among these H2O and CH3OH form after grain surface reactions (Ioppolo et al. 2008; Fuchs et al. 2009). Others (such as CO2 and OCS) form after irradiation of icy mantles (Ioppolo et al. 2009; Garozzo et al. 2010) and/or after surface reactions (e.g. Ioppolo et al. 2011; Noble et al. 2011).
In the last decades laboratory studies and theoretical models have shown that energetic processing induced by cosmic rays drive the evolution of dust grains in the interstellar medium. To be specific, the gas would take 109/nH = 5 × 10⁴ years to condense on grains in dense molecular clouds (Tielens & Allamandola 1987). The presence of gas phase species at later evolutionary time implies that desorption processes, such as photodesorption, grain-grain collisions, cosmic-ray-induced desorption and turbulence, compete with mantle accretion in these regions (e.g. Boland & de Jong 1982; Hasegawa & Herbst 1993; Bringa & Johnson 2004).
Carbon chain oxides, namely dicarbon monoxide (C2O) and tricarbon monoxide (C3O), and C3, have been detected towards star-forming regions (e.g. Matthews et al. 1984; Ohishi et al. 2001; Palumbo et al. 2008; Mookerjea et al. 2010). Because the observed abundance of these species cannot be explained by gas phase models (e.g., Smith et al. 2004; Garrod et al. 2006) it has recently been suggested that these species can form in the solid phase after ion irradiation of CO-rich icy mantles and are then released into the gas phase upon desorption from the grains (Palumbo et al. 2008). In the final stages of cloud collapse N-bearing species are also expected to freeze out onto grain mantles (e.g. Caselli et al. 2002; Bergin et al. 2002).
In this work we have experimentally investigated the effects of cosmic ion irradiation on CO:N2 ice mixtures. We have found that carbon chains and nitrogen oxides are formed. This article is organized as follows: in Sect. 2 we describe the experimental set-up and procedures, in Sect. 3 we present the experimental results and in Sect. 4 we discuss their astrophysical relevance.
2. Experimental set-up
Experiments were performed in the Laboratory for Experimental Astrophysics (INAF – Osservatorio Astrofisico di Catania, Italy). Infrared (IR) transmission spectra of solid samples were taken with a Fourier transform infrared (FTIR) spectrometer (Bruker Vertex 70) in the range 7800−600 cm-1 (1.3−16.6 μm) at a resolution of 1 cm-1. Experiments were carried out in a stainless steel high-vacuum chamber with a base pressure of about 10-7 mbar. Inside the vacuum chamber an IR transparent substrate (KBr or crystalline Si) is placed in thermal contact with a cold finger whose temperature can be varied between 10 K and 300 K and which is protected by a copper shield at 77 K.
Different CO:N2 gas mixtures were prepared in a pre-chamber connected to the vacuum chamber by a gas inlet and were then admitted into the chamber where they freeze on the substrate. The gas inlet is not directed towards the substrate, thus a “background deposition” is obtained. This method has the disadvantage that gas phase molecules can freeze out onto all cold surfaces inside the chamber. To avoid any deposit on the backside of the substrate, this is protected by a 2 cm long copper tube aligned with the IR beam and with a central hole with a diameter of about 4.5 mm. An He-Ne laser (543 nm) is used to monitor the thickness of the icy film during its deposition on the substrate. This is achieved by looking at the interference pattern (intensity versus time) given by the laser beam reflected at near normal incidence by the vacuum-film and film-substrate interfaces (see Baratta & Palumbo 1998; and Fulvio et al. 2009, for more details on the technique used to measure the thickness).
The vacuum chamber was connected to an ion implanter (Danfysik) from which ions with energy up to 200 keV (400 keV for double ionizations) are obtained. To avoid a macroscopic heating of the target, we used an ion current density between 100 nA cm-2 and a few μA cm-2. The ion beam is scanned electrostatically to ensure a uniform fluence on the target. The irradiated area is larger than that probed by the IR beam. The substrate holder forms an angle of 45° with both the ion beam and the IR beam. A more detailed description of the experimental set-up is given elsewhere (Strazzulla et al. 2001; Baratta et al. 2002; Palumbo et al. 2004).
The ices studied here were irradiated at 16 K with 200 keV H+ ions and then heated to 80−90 K. Spectra were acquired before and after ion irradiation at low temperature and, at the end of irradiation, after warming-up at different temperatures. During spectra acquisition the temperature is kept stable at the desired temperature. For each sample, two spectra were taken at all examined irradiation doses and temperatures one with the electric vector parallel (P polarized) and one perpendicular (S polarized) to the plane of incidence. Indeed, it is possible to select and analyse the P and S component of the transmitted IR beam separately with a polarizer placed in the path of the IR beam in front of the detector. As discussed by Baratta & Palumbo (1998) and Baratta et al. (2000), for “strong” absorption the profile of IR bands in P and S spectra is different while the profile of “weak” absorption bands is very similar. Because all studied bands caused by species formed by irradiation are “weak” absorption, we chose to analyse the P-polarized spectra because the signal to noise ratio is higher for this polarization. All spectra for a given polarization are ratioed to the corresponding background acquired before deposition of the gas mixtures onto the substrate.
When the irradiated sample is heated to room temperature a residue is left over on the substrate. This was analysed ex situ by micro Raman spectroscopy. Raman spectra were obtained using a continuous multiline Ar ion laser beam at 514.5 nm wavelength. A confocal microscope (DILOR) focuses the laser beam onto the sample in a 2 μm diameter spot with a power lower than 0.1 mW (100 μW) to avoid any laser-induced thermal modification. The Raman-scattered light arising from the illuminated spot is collected by the same objective and is collimated into a parallel beam that is reflected back along the same path of the laser. The Raman-scattered light is then focused on the entrance slit of the triplemate spectrometer (SPEX), which is equipped with a CCD detector. To check the alignment of the laser in the microscope, the Raman spectrum of crystalline Si, stored in the laboratory at room conditions, was taken before each measurement section. This Raman spectrum shows only two features at 520 cm-1 and 1000 cm-1 due to the first- and second-order band of the Si phonon, respectively. This shows that atmospheric pollution, if any, has negligible effects on the Raman spectrum under standard operating conditions. The spectral resolution used was 8 cm-1 with a peak accuracy of 1 cm-1.
Some characteristics of the analysed samples are listed in Table 1. In all examined cases the penetration depth of impinging ions is higher than the thickness of the sample, as verified using the SRIM code (Ziegler et al. 2008). Results do not depend on the used ion but on the deposited energy, i.e. dose, that is calculated from the knowledge of the stopping power, S, of the ions (energy loss per unit path length) and from the measurements of the fluence Φ, i.e. the number of impinging ions per unit of area (ions cm-2)  (1)However, when the same amount of energy (eV) is released to molecules of different molecular weight (e.g. methane, CH4, 16u; benzene, C6H6, 78u) the comparison between the experimental results is not straightforward. As discussed by Strazzulla & Johnson (1991), the dose given in units of eV per small molecule (16u) is a convenient way to characterize chemical changes and to compare the results obtained by irradiating different samples. The energy released to the sample by impinging ions (dose) is then given in eV/16u, where u is the unified atomic mass unit defined as 1/12 of the mass of an isolated atom of carbon-12. All transmittance spectra (If) are converted into optical depth units: τ(ν) = ln(I0/If), where I0 is the continuum.
Characteristics of the studied samples.
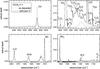 |
Fig. 1 IR transmission spectra, in optical depth scale, of CO:N2 = 1:1 mixture as deposited (dotted line) at 16 K on KBr substrate and after ion irradiation with 200 keV H+ (solid line). Labels indicate the molecular species studied here. From the top-left side, panels show the spectra in the spectral regions: 4360 − 4200 cm-1, 2425 − 2025 cm-1, 2010 − 1850 cm-1, and 1650 − 1000 cm-1. |
3. Results
The four panels in Fig. 1 show a forest of new peaks appearing in the IR spectra after irradiation of a CO:N2 = 1:1 mixture at 16 K. These peaks are caused by the formation of new molecular species in the ice upon irradiation. The formation of carbon chain oxides after ion irradiation of solid CO at 16 K with 200 keV H+ ions has been studied in detail by Palumbo et al. (2008). In the present work we considered five ice samples (listed in Table 1) that were irradiated at doses higher than those investigated by Palumbo et al. to study the formation of carbon chain oxides and nitrogen oxides. After irradiation of all CO-containing samples considered here the most abundant species formed is carbon dioxide (CO2). The evolution of this molecule has been discussed in detail by Ioppolo et al. (2009) and will not be considered here. In this work we have studied in detail the bands labelled in Fig. 1 that are generated by the molecular species listed in Table 2. To obtain their column density values from the IR spectra, we have measured the integrated intensity in optical depth scale (area) of the chosen band (∫τ(ν)dν) and divided it by the band strength value characteristic of that band (cm molecule-1). The used values are listed in Table 2. The column density was corrected by a factor cos θr, where θr is the refractive angle of the IR beam in the film. This correction takes into account the increased path length of the IR beam at an incidence angle θi = 45 deg (Fulvio et al. 2009; Modica & Palumbo 2010).
Peak position and band strength values (A) of absorption features.
Figures 2 − 4 show the ratio between the column density of selected molecules and the initial value of carbon monoxide (CO) as a function of irradiation dose to see how their abundance changes during ion irradiation. Since the 2140 cm-1 band is saturated in our spectra, the initial column density of CO was measured from the interference curve given by the He-Ne laser beam. From the thickness of the icy film and assuming an ice density equal to 0.8 g cm-3 (see Loeffler et al. 2005) it is possible to obtain the column density value for each mixture. Figure 2 shows the trend of column density of CO in the four mixtures. Because the 2140 cm-1 band is saturated in most of the analysed mixtures, the results plotted in Fig. 2 are relative to the overtone band at about 4253 cm-1 (2.35 μm). Indeed, from the top left panel of Fig. 1 relative to the mixture CO:N2 = 1:1, evidently the intensity of the 4253 cm-1 band, assigned to CO, decreases. As we can see from Fig. 2, the column density of CO decreases during irradiation (more quickly in the mixture CO:N2 = 1:8). As discussed by Loeffler et al. (2005), this decrease cannot be attributed to the removal of material by sputtering. An extrapolated value for the sputtering yield of a surface of CO exposed to 200 keV protons is 10 CO/proton (Brown et al. 1984), which means that about 1% of the material would have been removed at the highest dose. This decrease can be attributed to the destruction of CO molecules in the bulk of the sample, which contribute to the formation of other volatile molecules and of a refractory residue. The top x-axis in Figs. 2–4 gives an estimation of the time (years) necessary for interstellar ices to undergo the effects observed in the laboratory. Section 4 will address this point in more detail.
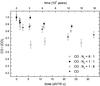 |
Fig. 2 Column density of CO divided by the initial one before irradiation for CO:N2 ice mixtures. The column density ratio is plotted as a function of dose. Timescale axes (top x-axis) give an estimate of the time (years) necessary for interstellar ices to undergo the effects observed in the laboratory. |
All features detected after irradiation are reported in Tables 3 and 4. The assignment of these features is based on experimental and theoretical studies published by Jamieson et al. (2006), Trottier & Brooks (2004), and Moore & Hudson (2003). The identification is also based on the results published by DeKock & Weltner (1971), Maier et al. (1991), Moll et al. (1966), Moazzen-Ahmadi & Zerbetto (1995), Holland et al. (1988), Jacox et al. (1965), and the Crovisier catalogue1 even though, in this latter case, the frequencies are relative to molecules in the gas phase. However, several features listed in these tables still remain unidentified and more experiments will be necessary for their identification.
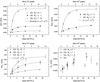 |
Fig. 3 Column density of NO, N2O, NO2, and O3 divided by the initial column density of CO before irradiation for CO:N2 ice mixtures. The column density ratio is plotted as a function of dose. Timescale axes (top x-axis) give an estimate of the time (years) necessary for interstellar ices to undergo the effects observed in the laboratory. Experimental data that refer to nitrogen oxides were fitted with an exponential curve y = a(1 − e − σD). |
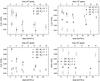 |
Fig. 4 Column density of C3O2, C2O, C3O, and OCN divided by the initial column density of CO before irradiation for CO:N2 ice mixtures. The column density ratio is plotted as a function of dose. Timescale axes (top x-axis) give an estimate of the time (years) necessary for interstellar ices to undergo the effects observed in the laboratory. |
Among the detected features we can see the presence of the band at about 2329 cm-1, assigned to N2. Although this molecule is homonuclear and symmetric without active infrared modes, its absorption band is present after ion irradiation. As discussed by Bernstein & Sandford (1999), the strength of the forbidden N2 fundamental band (at about 2329 cm-1) is moderately enhanced in the presence of NH3, strongly enhanced in the presence of H2O, and very strongly enhanced (by over a factor 1000) in the presence of CO2. The latter case could be due to a resonant interaction between the guest CO2 molecules and their N2 neighbours.
The absorption feature at about 2113 cm-1 was assigned by Jamieson et al. (2006) to the vibration of the carbon monoxide molecules chemisorbed on the silver substrate. However, the material of the substrate in our experimental set-up is different (KBr or Si), so this assignment is not appropriate in our case. Assuming that the peak position of a band assigned to a molecular species shifts with the inverse of the square-root of its reduced mass, we have assigned the 2113 cm-1 band to the isotope of the carbon monoxide C17O. The same assignment is given by Palumbo et al. (2008) and by Seperuelo-Duarte et al. (2010).
Features detected after ion irradiation of CO and CO:N2 icy samples and their identification in the range 4700 − 2000 cm-1.
Features detected after ion irradiation of CO and CO:N2 icy samples and their identification in the range 2000 − 650 cm-1.
3.1. Nitrogen oxides
Figure 3 shows the column density of nitrogen monoxide (NO), dinitrogen oxide (N2O), nitrogen dioxide (NO2) and ozone (O3) with respect to the initial carbon monoxide abundance as a function of dose after irradiation of different ice mixtures. As shown in the first three panels of this figure, the column density of the nitrogen oxides increases rapidly at low dose and then reaches a saturation value, indicating that an equilibrium is reached between the formation and the destruction mechanisms. The ratio of the column density of nitrogen oxides relative to the initial CO column density as a function of irradiation dose has been fitted with the exponential curve y = a(1 − e − σD), where a is the asymptotic value of the column density ratio, D is the dose (in eV/16 u) and σ is the process cross section (in 16 u/eV). The σ and a values found for each molecule are listed in Table 5. A larger amount of nitrogen oxides are formed in N2-rich mixtures, while no molecules with nitrogen are present after irradiation of pure CO, as expected.
3.2. Carbon chain oxides
After irradiating the samples, many carbon chain oxides are formed (see Tables 3 and 4). Here we study the evolution of dicarbon monoxide (C2O), tricarbon monoxide (C3O), and carbon suboxide (C3O2). As discussed by Palumbo et al. (2008), carbon chain oxides readily form at low doses and are then destroyed at higher doses. Here we used irradiation doses higher than those considered by Palumbo et al. (2008) and therefore we observed that the column densities of these molecules were very low in all samples (see Fig. 4). Therefore it was not possible to fit the experimental data with an exponential curve as we did for nitrogen oxides. The abundances of carbon chain oxides are higher in CO-rich mixtures, namely pure CO and CO:N2 = 8:1. The C3O2 band is not observed in the mixture CO:N2 = 1:8 because the amount of CO is too low with respect to N2. However, as we can see in the bottom left panel of Fig. 4, the molecule C3O is more abundant in the mixture CO:N2 = 1:1 but it is destroyed more quickly compared to the other mixtures.
3.3. Other species
The other species studied in detail in the present work are ozone (O3) and the radicals OCN and N3. After ion irradiation, the 1042 cm-1 band of O3 appears in all the spectra with an intensity that increased during irradiation. Furthermore, the O3/(CO)i ratio within the error bar is very similar in the different mixtures, as we can see from the bottom right panel of Fig. 3. Ioppolo et al. (2009) have shown that the CO2/(CO)i ratio does not depend on the CO:N2 initial mixtures. The similar trend observed for the O3/(CO)i and CO2/(CO)i ratios agrees with the suggestion that O3 is actually formed from CO2 (Loeffler et al. 2005). The band at 2106 cm-1 (4.75 μm) has also been assigned to O3 by Trottier & Brooks (2004), who investigated the effects of proton irradiation of CO ice films in the 4000 − 1900 cm-1 spectral range. Indeed, the IR spectrum of ozone shows the 2106 cm-1 band along with the band at about 1040 cm-1. Because the 2106 cm-1 is a combination mode (ν1+ν3), it is less intense than the fundamental mode (ν3) at about 1040 cm-1 (e.g., Brewer & Wang 1972). As shown in Fig. 5, both bands are detected in our spectra, but the 2106 cm-1 feature is always stronger than the 1042 cm-1 one. Furthermore, if we examine the integrated intensity (area) of both bands as a function of irradiation dose, we notice that they follow a different trend, which suggests that these two bands are not caused by the same species (Fig. 6). Therefore, we conclude on the basis of our experimental results, that the band at 2106 cm-1 formed after ion irradiation of CO:N2 ice mixtures is not caused by ozone. We have estimated that not more than 10% of the 2106 cm-1 band intensity can be caused by ozone. Jamieson et al. (2006) suggested that this band is caused by C5O, but more laboratory work is necessary for a firm identification.
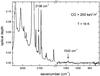 |
Fig. 5 Spectrum of pure CO after ion irradiation with 200 keV protons (dose = 32.5 eV/16 u) at 16 K. |
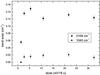 |
Fig. 6 Integrated intensity of the 2106 cm-1 and 1042 cm-1 bands as a function of dose after irradiation of pure CO at 16 K with 200 keV protons. |
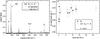 |
Fig. 7 a) IR transmission spectra of CO:N2 = 1:8 mixture as deposited (dotted line) at 16 K and after ion irradiation with 200 keV H+ (solid line) in the range 1700 − 1000 cm-1. The 1657 cm-1 band, assigned to N3, is not present in the other CO:N2 mixtures studied. b) Integrated intensity (area) of the 1657 cm-1 band as a function of dose, after ion irradiation of CO:N2 = 1:8 mixture and of pure N2. |
The band at about 1936 cm-1 which is not present after irradiation of pure CO and pure N2, is assigned to the radical OCN (Moore & Hudson 2003). As we can see from the bottom right panel of Fig. 4, the column density of this molecule is higher in the mixture with the highest amount of nitrogen and it decreases slowly with the irradiation dose. In the other mixtures the abundance of this molecule is very low but the trend of the column density with dose seems to be almost constant.
Values of best-fit parameters for nitrogen oxides in the three mixtures that contain both CO and N2.
Among the features listed in Tables 3 and 4, we have identified some carbon chains such as C3 (at about 2040 cm-1) and C6 (at about 1950 cm-1). To the best of our knowledge the band strength of these features is not known, therefore we assumed a value of 1 × 10-17 cm mol-1 for both bands. This value is indeed close to the average value measured for the absorption bands of many molecules (e.g., Mulas et al. 1998; Kerkhof et al. 1999; Bennett et al. 2004). With these assumptions we estimated that the value of the column density ratios C3/(CO)i and C6/(CO)i is about 10-4. The formation of these two species also suggests that other simple chains, such as C4 and C5, are formed, even if their identification is still uncertain.
Finally, in the mixture CO:N2 = 1:8 and in the pure N2 sample a band is observed at 1657 cm-1, which is assigned to the radical N3 (see Fig. 7). We do not know the band strength value for this molecular species therefore we cannot calculate the column density. We notice from the measurement of the band area that it increases with irradiation. The N3 band area values relative to pure N2 ice were scaled to take into account the different thickness of the samples and we assumed that the N3/N2 ratio does not depend on the initial mixture.
3.4. Warm-up
After irradiation was completed, ice mixtures were warmed up and spectra were taken at different temperatures. Figure 8 shows the spectra taken at 16, 40, 60, and 80 K for the mixture CO:N2 = 1:1. The most evident effect of the heating process is that the intensity of absorption bands formed after ion irradiation rapidly decreased with temperature. In the mixture CO:N2 = 1:1, the molecules C3O2, C3O, C2O, OCN, NO, and NO2 already desorb at 40 K. The other molecules studied here, N2O and O3, are present in the spectra until 80 K. The sublimation of CO takes place at about 35 K, but a small amount of CO remains trapped in the sample up to about 80 K. On the other hand, at this temperature the bands caused by carbon dioxide (CO2) are still very intense. After comparing the spectra of the same mixture at different temperatures, we observed a shift of the peak position of some bands. For example, the bands at 2235 cm-1 (see Fig. 8) and at 1290 cm-1, assigned to N2O, move towards higher frequencies of 7 and 14 cm-1, respectively, when the temperature is about 60 K. On the other hand, the peak position of the band at 1042 cm-1, assigned to O3, shifts by 4 cm-1 towards lower frequencies at about 40 K (see Fig. 9); besides, this band becomes broader and asymmetric because of the heating process. In the other heated samples we observed almost the same effects as in the CO:N2 = 1:1 mixture except that in the mixture CO:N2 = 8:1 the band at 2399 cm-1 caused by C3O2 is still present at 80 K, while in the CO:N2 = 1:8 mixture the band at 1290 cm-1 caused by N2O is no longer detectable at 40 K.
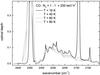 |
Fig. 8 Infrared transmission spectra of CO:N2 = 1:1 mixture after ion irradiation with 200 keV H+ (dose = 23.2 eV/16 u) at 16, 40, 60 and 80 K in the spectral region 2425 − 2050 cm-1. |
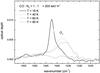 |
Fig. 9 Band profile of O3 at 16, 40, 60 and 80 K formed in the CO:N2 = 1:1 mixture after ion irradiation with 200 keV H+ (dose = 23.2 eV/16 u) in the spectral region 1060 − 1020 cm-1. |
3.5. Raman spectra of the residues
Figure 10 shows the Raman spectrum, taken ex situ, of the residue left over at room temperature after ion irradiation with 200 keV H+ of pure solid CO at 16 K. The spectrum obtained with a laser power of 60 μW shows a fluorescence continuum and a weak feature at about 1590 cm-1 that is attributed to a rather disordered amorphous carbon (G-line). As shown by in situ Raman spectra of irradiated samples (e.g. Baratta et al. 2004; Ferini et al. 2004), the residue is already formed after ion irradiation at low temperature. Annealing of the sample obtained by increasing the laser power by an order of magnitude determines an evolution of the Raman spectrum. In particular, the G-line becomes more intense, and a narrow and intense band appears centred at about 1360 cm-1 (D-line). This indicates a strong increase of the average sp2 cluster size (ordering).
The weak feature at about 1000 cm-1 is due to the second order of the 520 cm-1 Si phonon band observed in the crystalline Si substrate.
A residue is left over on the substrate also after ion irradiation of the studied CO:N2 mixtures while no residue is observed on the substrate after irradiation of the pure solid N2 sample.
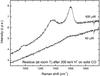 |
Fig. 10 Raman spectra of the residue left over at room temperature after irradiation of solid CO at 16 K with 200 keV H+. Two different values of the laser power have been used. |
4. Discussion
More than 150 molecular species have been detected in dense molecular clouds2. Among these, dicarbon monoxide (C2O) and tricarbon monoxide (C3O) have been observed in TMC-1 towards the cyanopolyyne peak (TMC-1CP) and it has been estimated that the fractional abundance of C2O is about 6 × 10-11 and that of C3O is about 1.4 × 10⁻¹⁰ (e.g., Ohishi et al. 2001). Tricarbon monoxide has also been detected in other objects, such as L1498 (Palumbo et al., in prep.), IRAS 16293-2422 (Ceccarelli, priv. comm.) and Elias 18 (Palumbo et al. 2008). These sources cover different phases of low-mass star formation: TMC-1CP is a dense core in the TMC-1 cold dark cloud and represents the earliest phase of star formation; L1498 is a pre-protostellar core (PPC) or starless core (e.g. Tafalla et al. 2004; 2006); IRAS 16293-2422 is a class 0 object with a hot corino (Bottinelli et al. 2004; Bisschop et al. 2008), which is the inner warm region of the envelope of a low-mass protostar; Elias 18 is a class II low-mass protostar that resides in a part of the Taurus molecular cloud known as Heiles cloud 2 (HCL2). On the other hand, carbon suboxide (C3O2) cannot be observed in the gas phase in the millimeter spectral region because it is a linearly symmetric molecule with no active rotation modes. Gas-phase models do not predict the observed abundance of carbon chain oxides (e.g., Smith et al. 2004; Garrod et al. 2006). Therefore it has recently been suggested that these species form in the solid phase after ion irradiation of CO-rich icy mantles and are then released in the gas phase after desorption of icy mantles (Palumbo et al. 2008).
Triatomic carbon, C3, has been detected in absorption in the direction of Sagittarius B2 with a fractional abundance equal to 3 × 10⁻⁸ (Cernicharo et al. 2000) and in the line of sight of the star-forming cores W31C and W49N with a fractional abundance ~10-8 (Mookerjea et al. 2010).
The molecular cloud Sagittarius B2 is, to the best of our knowledge, the only source where both nitrogen oxides, NO and N2O, have been detected (Ziurys et al. 1994; Halfen et al. 2001). This region has been observed along different lines of sight and it has been estimated that the fractional abundance of NO is about 1.5 × 10⁻⁸ and that of N2O is about 1.5 × 10⁻⁹ (Halfen et al. 2001). NO is widely observed in dense molecular clouds (e.g. Halfen et al. 2001; Akylmaz et al. 2007) and can be formed by gas-phase reactions. The fractional abundance of N2O is almost two orders of magnitude higher than predicted by low-temperature gas-phase chemical models (Millar et al. 1997). Then it has been suggested that this molecule is preferentially formed through high-temperature gas-phase reactions (Halfen et al. 2001). Nitrogen dioxide, NO2, has been extensively searched towards Sgr B2 and other objects but it has not been detected and only upper limits have been estimated for this molecule (NO2/H2 ≤ 3.3 × 10⁻⁹; Halfen et al. 2001).
It has been observed that the fractional abundance of CO in the gas phase in dense molecular clouds is of the order of 10-4 (Frerking et al. 1982), and the abundance of carbon chain oxides compared to CO is about 10-7 − 10-6 and that of nitrogen oxides is about 10-5 − 10-4. Our laboratory experiments indicate that the amount of carbon chain oxides and nitrogen oxides formed after ion irradiation at 16 K with 200 keV protons is of the order of 10-3−10-2 compared to the initial CO (Figs. 3 and 4). These experimental results support the hypothesis (e.g., Miao et al. 1995; Halfen et al. 2001) that these molecular species (other than NO) are formed in the solid phase and then are released into the gas phase when desorption of icy mantles takes place.
To estimate the time necessary to obtain the effects observed in the laboratory in dense molecular clouds, we have considered that the flux of cosmic ions, in the approximation of effective monoenergetic 1-MeV protons, is 1 proton cm-2 s-1. This value has been obtained by Mennella et al. (2003) assuming that the cosmic ionization rate is ζCR = 6 × 10-17 s-1. This flux must be regarded as an effective quantity. It represents the flux of 1-MeV protons, which gives rise to the ionization rate produced by the cosmic ray spectrum if hydrogen were the only source for ionization. Furthermore, we assumed that the laboratory results are due to the total dose of irradiation, therefore they scale with the stopping power (S) of impinging ions. Using the SRIM code (Ziegler et al. 2008), we estimated that for protons S(1 MeV) = 1.7 eV/Å and S(200 keV) = 6.4 eV/Å for pure CO ice. The stopping power of protons in CO:N2 mixtures is very similar (see Table 1), consequently we can use the same timescale, within the errors, as found for pure CO. With these hypotheses we have indicated the timescale axis (top x-axis) in Figs. 2–4. From the exponential equation used to fit the data relative to nitrogen oxides (Fig. 3), we obtain that about 104–106 years are needed to form the observed column density in Sgr B2 for a high CO depletion and assuming that the column density of the molecular species obtained in the solid phase after irradiation is maintained in the gas phase after desorption of icy grain mantles. This time is shorter than the evolution time scale of molecular clouds (a few 107 years; Larson 2003), thus the observed gas phase abundance of nitrogen oxides could be easily reached even if CO is not completely depleted and/or only partial desorption of icy grain mantles takes place.
However, more observational data are necessary to confirm these results. There are still open questions about the abundance of some molecules, such as NO2, which has not yet been detected, that can help us to understand the role of ion irradiation in the formation of interstellar molecules. Thanks to its high sensitivity and resolution, the Atacama Large Millimeter-submillimeter Array (ALMA) will give important results that will increase the number of detected features in a larger sample of molecular clouds.
Acknowledgments
We would like to thank F. Spinella for his technical assistance during laboratory measurements and G. Strazzulla for useful discussions during this work. This research is in part funded by the LASSIE Initial Training Network, which is supported by the European Community’s Seventh Framework Programme under Grant Agreement Number 238258.
References
- Akyilmaz, M., Flower, D. R., Hily-Blant, P., Pineau des Forêts, G., & Walmsley, C. M. 2007, A&A, 462, 221 [NASA ADS] [CrossRef] [EDP Sciences] [Google Scholar]
- Baratta, G. A., & Palumbo, M. E. 1998, JOSA A, 15, 3076 [NASA ADS] [CrossRef] [Google Scholar]
- Baratta, G. A., Palumbo, M. E., & Strazzulla, G. 2000, A&A, 357, 1045 [NASA ADS] [Google Scholar]
- Baratta, G. A., Leto, G., & Palumbo, M. E. 2002, A&A, 384, 343 [NASA ADS] [CrossRef] [EDP Sciences] [Google Scholar]
- Baratta, G. A., Mennella, V., Brucato, J. R., et al. 2004, J. Raman Spectroscopy, 35, 487 [Google Scholar]
- Bennett, C. J., Jamieson, C., Mebel, A. M., & Kaiser, R. I. 2004, Phys. Chem. Chem. Phys., 6, 735 [CrossRef] [Google Scholar]
- Bergin, E. A., Alves, J., Huard, T., & Lada, C. J. 2002, ApJ, 570, L101 [NASA ADS] [CrossRef] [Google Scholar]
- Bernstein, M. P., & Sandford, S. A. 1999, Spectrochim. Acta, 55, 2455 [CrossRef] [Google Scholar]
- Bisschop, S. E., Jrgensen, J. K., Bourke, T. L., Bottinelli, S., & van Dishoeck, E. F. 2008, A&A, 488, 959 [NASA ADS] [CrossRef] [EDP Sciences] [Google Scholar]
- Boland, W., & de Jong, T. 1982, ApJ, 261, 110 [NASA ADS] [CrossRef] [Google Scholar]
- Boogert, A. C. A., Pontoppidan, K. M., Knez, C., et al. 2008, ApJ, 678, 985 [NASA ADS] [CrossRef] [Google Scholar]
- Bottinelli, S., Ceccarelli, C., Neri, R., et al. 2004, ApJ, 617, L69 [NASA ADS] [CrossRef] [Google Scholar]
- Bottinelli, S., Boogert, A. C. A., Bouwman, J., et al. 2010, ApJ, 718, 1100 [NASA ADS] [CrossRef] [Google Scholar]
- Brady Ford, A., & Shirley, Y. L. 2011, ApJ, 728, 144 [NASA ADS] [CrossRef] [Google Scholar]
- Brewer, L., & Wang, J. L.-F. 1972, J. Chem. Phys., 56, 759 [NASA ADS] [CrossRef] [Google Scholar]
- Bringa, E. M., & Johnson, R. E. 2004, ApJ, 603, 159 [NASA ADS] [CrossRef] [Google Scholar]
- Bringa, E. M., Kucheyev, S. O., Loeffler, M. J., et al. 2007, ApJ, 662, 372 [NASA ADS] [CrossRef] [Google Scholar]
- Brown, W. L., Augustyniak, W. M., Macartonio, K. J., et al. 1984, Nucl. Instr. Meth. Phys. Res. B, 1, 307 [Google Scholar]
- Caselli, P., Walmsley, C. M., Tafalla, M., Dore, L., & Myers, P. C. 1999, ApJ, 523, L165 [NASA ADS] [CrossRef] [Google Scholar]
- Caselli, P., Walmsley, C. M., Zucconi, A., et al. 2002, ApJ, 565, 331 [NASA ADS] [CrossRef] [Google Scholar]
- Cernicharo, J., Goicoechea, J. R., & Caux, E. 2000, ApJ, 534, L199 [NASA ADS] [CrossRef] [PubMed] [Google Scholar]
- Chiar, J. E., Adamson, A. J., Kerr, T. H., & Whittet, D. C. B. 1994, ApJ, 426, 240 [NASA ADS] [CrossRef] [Google Scholar]
- Chiar, J. E., Adamson, A. J., Kerr, T. H., & Whittet, D. C. B. 1995, ApJ, 455, 234 [NASA ADS] [CrossRef] [Google Scholar]
- DeKock, R., & Weltner, W. 1971, J. Am. Chem. Soc., 93, 7106 [CrossRef] [Google Scholar]
- Ferini, G., Baratta, G. A., & Palumbo, M. E. 2004, A&A, 414, 757 [NASA ADS] [CrossRef] [EDP Sciences] [Google Scholar]
- Frerking, M. A., Langer, W. D., & Wilson, R. W. 1982, ApJ, 262, 590 [NASA ADS] [CrossRef] [Google Scholar]
- Fuchs, G. W., Cuppen, H. M., Ioppolo, S., et al. 2009, A&A, 505, 629 [NASA ADS] [CrossRef] [EDP Sciences] [Google Scholar]
- Fulvio, D., Sivaraman, B., Baratta, G. A., Palumbo, M. E., & Mason, N. J. 2009, Spectrochim. Acta A, 72, 1007 [NASA ADS] [CrossRef] [Google Scholar]
- Garozzo, M., Fulvio, D., Kanuchova, Z., Palumbo, M. E., & Strazzulla, G. 2010, A&A, 509, A67 [NASA ADS] [CrossRef] [EDP Sciences] [Google Scholar]
- Garrod, R., Park, I. H., Caselli, P., & Herbst, E. 2006, Faraday Discuss., 133, 51 [NASA ADS] [CrossRef] [PubMed] [Google Scholar]
- Gibb, E. L., Whittet, D. C. B., Boogert, A. C. A., & Tielens, A. G. G. M. 2004, ApJS, 151, 35 [NASA ADS] [CrossRef] [PubMed] [Google Scholar]
- Greenberg, J. M. 1982, in Comets, ed. L. L. Wilkening (Tucson: The University of Arizona Press), 131 [Google Scholar]
- Halfen, D. T., Apponi, A. J., & Ziurys, L. M. 2001, ApJ, 561, 244 [NASA ADS] [CrossRef] [Google Scholar]
- Hasegawa, T. I., & Herbst, E. 1993, MNRAS, 261, 83 [NASA ADS] [CrossRef] [Google Scholar]
- Holland, F., Winnewisser, M., Maier, G., Reisenauer, H., & Ulrich, A. 1988, J. Mol. Spectrosc., 130, 470 [NASA ADS] [CrossRef] [Google Scholar]
- Ioppolo, S., Cuppen, H. M., Romanzin, C., van Dishoeck, E. F., & Linnartz, H. 2008, ApJ, 686, 1474 [NASA ADS] [CrossRef] [Google Scholar]
- Ioppolo, S., Palumbo, M. E., Baratta, G. A., & Mennella, V. 2009, A&A, 493, 1017 [NASA ADS] [CrossRef] [EDP Sciences] [Google Scholar]
- Ioppolo, S., van Boheemen, Y., Cuppen, H. M., van Dishoeck, E. F., & Linnartz, H. 2011, MNRAS, 413, 2281 [NASA ADS] [CrossRef] [Google Scholar]
- Jacox, M., Milligan, D., Moll, N. G., & Thompson, W. E. 1965, J. Chem. Phys., 43, 3734 [NASA ADS] [CrossRef] [Google Scholar]
- Jamieson, C. S., Mebel, A. M., & Kaiser, R. I. 2006, ApJS, 163, 184 [NASA ADS] [CrossRef] [Google Scholar]
- Jenniskens, P., Baratta, G. A., Kouchi, A., et al. 1993, A&A, 273, 583 [NASA ADS] [Google Scholar]
- Kerkhof, O., Schutte, W. A., & Ehrenfreund, P. 1999, A&A, 346, 990 [NASA ADS] [Google Scholar]
- Larson, R. B. 2003, Rep. Prog. Phys., 66, 1651 [NASA ADS] [CrossRef] [Google Scholar]
- Loeffler, M. J., Baratta, G. A., Palumbo, M. E., Strazzulla, G., & Baragiola, R. A. 2005, A&A, 435, 587 [NASA ADS] [CrossRef] [EDP Sciences] [MathSciNet] [Google Scholar]
- Matthews, H. E., Irvine, W. M., Friberg, P., Brown, R. D., & Godfrey, P. D. 1984, Nature, 310, 125 [NASA ADS] [CrossRef] [Google Scholar]
- Maier, G., Reisenauer, H., & Ulrich, A. 1991, Tetrahedron Lett., 32, 4469 [CrossRef] [Google Scholar]
- Mennella, V., Baratta, G. A., Esposito, A., Ferini, G., & Pendleton, Y. J. 2003, ApJ, 587, 727 [NASA ADS] [CrossRef] [EDP Sciences] [Google Scholar]
- Miao, Y., Mehringer, D., Kuan, Y. J., & Snyder, L. E. 1995, ApJ, 445, L59 [NASA ADS] [CrossRef] [Google Scholar]
- Millar, T. J., Farquhar, P. R. A., & Willacy, K. 1997, A&AS, 121, 139 [NASA ADS] [CrossRef] [EDP Sciences] [Google Scholar]
- Moazzen-Ahmadi, N., & Zerbetto, F. 1995, J. Chem. Phys., 103, 6343 [NASA ADS] [CrossRef] [Google Scholar]
- Modica, P., & Palumbo, M. E. 2010, A&A, 519, A22 [NASA ADS] [CrossRef] [EDP Sciences] [Google Scholar]
- Moll, N. G., Clutter, D. R., & Thompson, W. 1966, J. Chem. Phys., 45, 4469 [NASA ADS] [CrossRef] [Google Scholar]
- Mookerjea, B., Giesen, T., Stutzki, J., et al. 2010, A&A, 521, L13 [NASA ADS] [CrossRef] [EDP Sciences] [Google Scholar]
- Moore, M. H., & Hudson, R. L. 2003, Icarus, 161, 486 [NASA ADS] [CrossRef] [Google Scholar]
- Mulas, G., Baratta, G. A., Palumbo, M. E., & Strazzulla, G. 1998, A&A, 333, 1025 [NASA ADS] [Google Scholar]
- Noble, J. A., Dulieu, F., Congiu, E., & Fraser, H. J. 2011, ApJ, 735, 121 [NASA ADS] [CrossRef] [Google Scholar]
- Öberg, K. I., Boogert, A. C. A., Pontoppidan, K. M., et al. 2008, ApJ, 678, 1032 [NASA ADS] [CrossRef] [Google Scholar]
- Ohishi, M., Ishikawa, S., Yamada, C., et al. 1991, ApJ, 380, 39 [Google Scholar]
- Palumbo, M. E., & Strazzulla, G. 1993, A&A, 269, 568 [NASA ADS] [Google Scholar]
- Palumbo, M. E., Ferini, G., & Baratta, G. A. 2004, Adv. Space Res., 33, 49 [NASA ADS] [CrossRef] [Google Scholar]
- Palumbo, M. E., Leto, P., Siringo, C., & Trigilio, C. 2008, ApJ, 685, 1033 [NASA ADS] [CrossRef] [Google Scholar]
- Pontoppidan, K. M., Boogert, A. C. A., Fraser, H. J., et al. 2008, ApJ, 678, 1005 [NASA ADS] [CrossRef] [Google Scholar]
- Seperuelo Duarte, E., Domaracka, A., Boduch, P., et al. 2010, A&A, in press [Google Scholar]
- Smith, I. W. M., Herbst, E., & Chang, Q. 2004, MNRAS, 350, 323 [NASA ADS] [CrossRef] [Google Scholar]
- Strazzulla, G., & Johnson, R. E. 1991, in Comets in the post-Halley era, 1, ASSL Series, Dordrecht, 243 [Google Scholar]
- Strazzulla, G., Baratta, G. A., & Palumbo, M. E. 2001, Spectrochim. Acta A, 57, 825 [NASA ADS] [CrossRef] [Google Scholar]
- Tafalla, M., Myers, P. C., Caselli, P., & Walmsley, C. M. 2004, A&A, 416, 191 [NASA ADS] [CrossRef] [EDP Sciences] [Google Scholar]
- Tafalla, M., Santiago-García, J., Myers, P. C., et al. 2006, A&A, 455, 577 [NASA ADS] [CrossRef] [EDP Sciences] [Google Scholar]
- Teixeira, T., Emerson, J. P., & Palumbo, M. E. 1998, A&A, 330, 711 [NASA ADS] [Google Scholar]
- Tielens, A. G. G. M., & Allamandola, L. J. 1987, in Physical processes in interstellar clouds, eds. G. E. Morfill, & M. Scholer (Dordrecht: Reidel), 333 [Google Scholar]
- Tielens, A. G. G. M., Tokunaga, A. T., Geballe, T. R., & Baas, F. 1991, ApJ, 381, 181 [NASA ADS] [CrossRef] [PubMed] [Google Scholar]
- Trottier, A., & Brooks, R. L. 2004, ApJ, 612, 1214 [NASA ADS] [CrossRef] [Google Scholar]
- Westley, M. S., Baragiola, R. A., Johnson, R. E., & Baratta, G. A. 1993, Nature, 373, 405 [Google Scholar]
- Whittet, D. C. B., Gerakines, P. A., Tielens, A. G. G. M., et al. 1998, ApJ, 498, L159 [NASA ADS] [CrossRef] [Google Scholar]
- Ziegler, J. F., Biersack, J. P., & Ziegler, M. D. 2008, The stopping and range of ions in solids (New York: Pergamon Press), http://www.srim.org [Google Scholar]
- Ziurys, L. M., Apponi, A. J., Hollis, J. M., & Snyder, L. E. 1994, ApJ, 436, L181 [NASA ADS] [CrossRef] [Google Scholar]
All Tables
Features detected after ion irradiation of CO and CO:N2 icy samples and their identification in the range 4700 − 2000 cm-1.
Features detected after ion irradiation of CO and CO:N2 icy samples and their identification in the range 2000 − 650 cm-1.
Values of best-fit parameters for nitrogen oxides in the three mixtures that contain both CO and N2.
All Figures
|
Fig. 1 IR transmission spectra, in optical depth scale, of CO:N2 = 1:1 mixture as deposited (dotted line) at 16 K on KBr substrate and after ion irradiation with 200 keV H+ (solid line). Labels indicate the molecular species studied here. From the top-left side, panels show the spectra in the spectral regions: 4360 − 4200 cm-1, 2425 − 2025 cm-1, 2010 − 1850 cm-1, and 1650 − 1000 cm-1. |
| In the text | |
|
Fig. 2 Column density of CO divided by the initial one before irradiation for CO:N2 ice mixtures. The column density ratio is plotted as a function of dose. Timescale axes (top x-axis) give an estimate of the time (years) necessary for interstellar ices to undergo the effects observed in the laboratory. |
| In the text | |
|
Fig. 3 Column density of NO, N2O, NO2, and O3 divided by the initial column density of CO before irradiation for CO:N2 ice mixtures. The column density ratio is plotted as a function of dose. Timescale axes (top x-axis) give an estimate of the time (years) necessary for interstellar ices to undergo the effects observed in the laboratory. Experimental data that refer to nitrogen oxides were fitted with an exponential curve y = a(1 − e − σD). |
| In the text | |
|
Fig. 4 Column density of C3O2, C2O, C3O, and OCN divided by the initial column density of CO before irradiation for CO:N2 ice mixtures. The column density ratio is plotted as a function of dose. Timescale axes (top x-axis) give an estimate of the time (years) necessary for interstellar ices to undergo the effects observed in the laboratory. |
| In the text | |
|
Fig. 5 Spectrum of pure CO after ion irradiation with 200 keV protons (dose = 32.5 eV/16 u) at 16 K. |
| In the text | |
|
Fig. 6 Integrated intensity of the 2106 cm-1 and 1042 cm-1 bands as a function of dose after irradiation of pure CO at 16 K with 200 keV protons. |
| In the text | |
|
Fig. 7 a) IR transmission spectra of CO:N2 = 1:8 mixture as deposited (dotted line) at 16 K and after ion irradiation with 200 keV H+ (solid line) in the range 1700 − 1000 cm-1. The 1657 cm-1 band, assigned to N3, is not present in the other CO:N2 mixtures studied. b) Integrated intensity (area) of the 1657 cm-1 band as a function of dose, after ion irradiation of CO:N2 = 1:8 mixture and of pure N2. |
| In the text | |
|
Fig. 8 Infrared transmission spectra of CO:N2 = 1:1 mixture after ion irradiation with 200 keV H+ (dose = 23.2 eV/16 u) at 16, 40, 60 and 80 K in the spectral region 2425 − 2050 cm-1. |
| In the text | |
|
Fig. 9 Band profile of O3 at 16, 40, 60 and 80 K formed in the CO:N2 = 1:1 mixture after ion irradiation with 200 keV H+ (dose = 23.2 eV/16 u) in the spectral region 1060 − 1020 cm-1. |
| In the text | |
|
Fig. 10 Raman spectra of the residue left over at room temperature after irradiation of solid CO at 16 K with 200 keV H+. Two different values of the laser power have been used. |
| In the text | |
Current usage metrics show cumulative count of Article Views (full-text article views including HTML views, PDF and ePub downloads, according to the available data) and Abstracts Views on Vision4Press platform.
Data correspond to usage on the plateform after 2015. The current usage metrics is available 48-96 hours after online publication and is updated daily on week days.
Initial download of the metrics may take a while.