Fig. 3
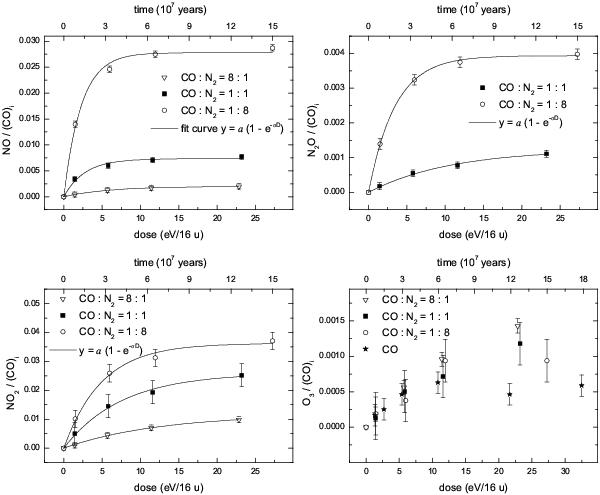
Column density of NO, N2O, NO2, and O3 divided by the initial column density of CO before irradiation for CO:N2 ice mixtures. The column density ratio is plotted as a function of dose. Timescale axes (top x-axis) give an estimate of the time (years) necessary for interstellar ices to undergo the effects observed in the laboratory. Experimental data that refer to nitrogen oxides were fitted with an exponential curve y = a(1 − e − σD).
Current usage metrics show cumulative count of Article Views (full-text article views including HTML views, PDF and ePub downloads, according to the available data) and Abstracts Views on Vision4Press platform.
Data correspond to usage on the plateform after 2015. The current usage metrics is available 48-96 hours after online publication and is updated daily on week days.
Initial download of the metrics may take a while.