| Issue |
A&A
Volume 543, July 2012
|
|
|---|---|---|
| Article Number | A87 | |
| Number of page(s) | 9 | |
| Section | Galactic structure, stellar clusters and populations | |
| DOI | https://doi.org/10.1051/0004-6361/201219306 | |
| Published online | 02 July 2012 | |
Proper motions and membership probabilities of stars in the region of globular cluster NGC 6809⋆,⋆⋆
1 Aryabhatta Research Institute of Observational Sciences, Manora Peak, 263129 Nainital, India
e-mail: This email address is being protected from spambots. You need JavaScript enabled to view it.
; This email address is being protected from spambots. You need JavaScript enabled to view it.
2 Dipartimento di Astronomia, Universita di Padova, Vicolo dell’ Osservatorio 2, 35122 Padova, Italy
e-mail: This email address is being protected from spambots. You need JavaScript enabled to view it.
Received: 29 March 2012
Accepted: 9 May 2012
Abstract
Context. NGC 6809 is a luminous metal-poor halo globular cluster that is relatively easy to study due to its proximity and low concentration. Because of its high Galactic latitude (b = −23°), interstellar reddening and contamination is not very high.
Aims. We aim to determine the relative proper motion and membership probability of the stars in the wide area of globular cluster NGC 6809. To target cluster members reliably during spectroscopic surveys and both spatial and radial distributions in the cluster outskirts without including field stars, a good proper motion and membership probability catalogue of NGC 6809 is required.
Methods. The archival data of two epochs with a time-base line of 7.1 years have been collected with Wide Field Imager (WFI) mounted on the 2.2 m MPG/ESO telescope. The CCD images of both epochs have been reduced using the astrometric techniques as described in Anderson et al. (2006). The calibrated UBVI magnitudes have been derived using Stetson’s secondary standard stars.
Results. We derived the relative proper motion and membership probabilities for ~12 600 stars in the field of globular cluster NGC 6809. The measurement error in proper motions for the stars of V ~ 17 mag is 2.0 mas yr-1, gradually increasing up to ~3 mas yr-1 at V = 20 mag. We also provide the membership probability for the published different types of sources in NGC 6809. An electronic catalogue with proper motion and membership probability for the stars will be available to the astronomical community.
Key words: globular clusters: individual: NGC 6809
Based on observations with the MPG/ESO 2.2 m and ESO/VLT telescopes, located at La Silla and Paranal Observatory, Chile, under DDT programs 077.D-0372(A), 163.O-0741(C) and the archive material.
Full Table 5 is only available at the CDS via anonymous ftp to cdsarc.u-strasbg.fr (130.79.128.5) or via http://cdsarc.u-strasbg.fr/viz-bin/qcat?J/A+A/543/A87
© ESO, 2012
1. Introduction
Globular clusters have long been used to study the structure and formation of our Galaxy. NGC 6809 (M 55) is a sparse, metal-poor globular cluster whose proximity (~5 kpc) makes it an excellent target for an in-depth study of its stellar population.
NGC 6809 harbours several interesting objects. Bassa et al. (2008) found 16 X-ray sources within the half-mass radius (2 89) of NGC 6809, of which eight or nine are expected to be background sources. On the basis of optical counterparts, these authors identified three sources related to the cluster. The brightest X-ray source of this cluster is classified as a dwarf nova. Blue stragglers in NGC 6809 have been studied by Lanzoni et al. (2007) and exhibit a bimodal radial distribution with a central peak, a broad minimum at intermediate radii, and an upturn outwards. A detailed study about the evolved stars, including asymptotic giant branch, horizontal branch, and upper red giant branch (RGB) stars was presented by Vargas et al. (2007).
A proper-motion (PM) study of NGC 6809 was conducted by Dinescu et al. (1999) using photographic plates. The authors determined an absolute proper motion (μαcosδ = −1.57 ± 0.62 mas yr-1, μδ = −10.14 ± 0.64 mas yr-1) using a sample of ~600 cluster stars brighter than V ~ 16 photographic magnitude and background galaxies as a reference. Recently, a proper motion study of NGC 6809 was performed by Zloczewski et al. (2011, hereafter Zl11). They determined membership probabilities for 16 645 stars in the central part of the cluster  and found an absolute proper motion μαcosδ = −3.31 ± 0.10 mas yr-1 and μδ = −9.14 ± 0.15 mas yr-1.
Despite the extensive photometric studies of this cluster, there is a lack of studies that provide proper motions and membership probabilities in the wide field region for NGC 6809. Wide-field images allow us to map completely any open or globular cluster in our Galaxy and its tidal trails and allow us to obtain accurate photometry for an enormous number of stars. In combination in photometric data, membership information is very useful to keep the field star contamination to a minimum. The archival wide-field multi-epoch observations taken with the WFI/2.2 m telescope offer new opportunities to derive precise PMs with only a few years of time span, deeper by several magnitudes than previous photographic surveys (Anderson et al. 2006; Yadav et al. 2008; Bellini et al. 2009).
The main purpose of the present study is to determine accurate relative PMs and membership probabilities for stars brighter than V ~ 20 mag in the wide area of NGC 6809. Membership probabilities of different sources in NGC 6809 are also discussed. Fundamental parameters of the cluster taken from Harris (1996) are listed in Table 1. The PMs, membership probabilities, and photometric U,B,V and I magnitudes are provided to the astronomical community for follow-up studies. Our membership-probability catalogue is in wide field (26′ × 22′) and contains UBVI magnitudes, while Zl11 have provided membership probabilities only in V magnitude and in the central area of  .
.
The structure of the article is as follows. Data taken for the present study, their reduction procedures and comparison of photometric and astrometric data are described in Sect. 2, where we also determine PMs and differential chromatic refraction. In Sect. 3 we present the cluster membership analysis. In Sect. 4 we use our catalogue to confirm the membership of previously found variables, blue stragglers, and X-ray sources. Finally, Sect. 5 describes the catalogue while Sect. 6 represents the conclusions of the present study.
2. Archival data and reductions
Proper motions of the stars in the cluster region were computed using archive WFI/2.2 m V filter images1 taken in 1999 (first epoch) and in 2006 (second epoch). The 1999 observing run consists of two images in B filter, taken in May, while four images in V and eight images in I were taken in July. Six U-band images and six V-band images were acquired in August, 2006.
The WFI/2.2 m consists of eight 2048 × 4096 EEV CCDs with  pixel-1 resulting in a total field-of-view 34′ × 33′. The observational log with epoch information is listed in Table 2. Images used in the analysis were taken under similar seeing (~1′′) and airmass conditions. Long and short exposures were acquired to map the brighter and fainter stars of the cluster. The data used in this article were not collected with the aim of proper motion study.
Description of the WFI/2.2 m data sets.
2.1. Astromeric and photometric reductions
The reduction procedures described in Anderson et al. (2006, Paper I) were adopted for the WFI/2.2 m CCD images. This includes de-biasing, flat-fielding, and correction for cosmic rays. In Paper I we showed that the WFI/2.2 m PSF changes significantly with position on the detector. Because of this, an array of empirical point spread functions (PSFs) were constructed for each image to obtain the positions and fluxes of the objects. These PSFs are saved in a look-up table on a very fine grid. To select suitable stars for the PSFs, we developed an automatic code (see Paper I). An iterative process is designed to work from the brightest down to the faintest stars and find their precise position and instrumental flux for U, B, V and I exposures.
In Paper I we showed that WFI/2.2 m has a large geometric distortion, i.e. the pixel scale is changing across the field of view. To derive the correction for the geometric distortion, we parametrized the distortion solution by a look-up table of corrections for each chip that covered 2048 × 4096 pixel each, sampling every 256 pixels. This resulted in a 9 × 17 element array of corrections for each chip. At any given location on the detector, a bi-linear interpolation between the four closest grid points of the look-up table provided the corrections for the target point. The derived look-up table may have a lower accuracy on the edges of a field because of the way the self-calibration frames were dithered (see Paper I). An additional source of uncertainty is related to a possible instability of distortions for the WFI/2.2 m reported earlier. This prompted us to use the local-transformation method to derive PMs. Detailed descriptions about the distortion solution are given in Paper I.
In the local transformation approach a small set of local reference stars is selected around each target object. It is advantageous to use pre-selected cluster members to form a local reference frame because of the much lower intrinsic velocity dispersion among the cluster members. Then, six-parameter linear transformations are used to transform the coordinates from one frame into another, taken at different epochs. The residuals of this transformation characterize relative PMs convolved with measurement errors. In essence, this is a classical “plate pair” method but extended to all possible combinations of the first- and second- epoch frames. The relative PM of a target object is an average of all displacement measurements in its local reference frame. The last step is to estimate the measurement errors from intra-epoch observations where PMs have a zero contribution. A complete description of all steps leading to PMs is given in Paper I.
2.1.1. Photometric calibration
In order to transform instrumental U, B, V, I magnitudes into the standard Johnson-Cousin system, we used a list of secondary standard stars provided by Stetson2 for B, V and I and by Kaluzny et al. (2005) for U filter. In total, 851 common stars were found in Stetson’s catalogue and were used to calibrate B, V and I magnitudes. These common stars have a brightness range of 12.9 ≤ V ≤ 20.6 mag and a colour range of − 0.5 ≤ (V − I) ≤ 2.0 mag, which coveres all stars brighter than V = 20.0 mag. 1205 common stars brighter than V = 19 mag were found in the Kaluzny et al. (2005) catalogue. These stars have a colour range of − 0.5 ≤ (U − B) ≤ 1.3 mag.
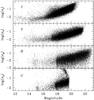 |
Fig. 1 Plot of the rms logarithm of the residuals around the mean magnitudes in U,B,V and I as a function of their magnitudes. |
We derived photometric zero-points and colour terms using the following transformation equations:  where the subscript “ins” means instrumental magnitudes and “std” stands for secondary standard magnitudes. Cu,Cb,Cv and Ci are the colour terms while Zu,Zb,Zv and Zi are the global zero-points. The quadratic colour terms are negligible. The values of colour terms are 0.00, 0.70, 0.00, and 0.11, while the zero-points are 22.68, 24.95, 24.18, and 23.34 for U, B, V and I filters respectively. Our colour terms and zero-point values are nearly consistent with those posted on the WFI/2.2 m webpage3.
In Fig. 1 we show the log of rms of the residuals around the mean magnitude for each filter as a function of the respective magnitudes. The photometric standard deviations were computed from multiple observations, all reduced to the common photometric reference frame in the chosen bandpass. On average, photometric rms are better than ~0.03 mag for stars brighter than 18.0 mag in U,B and V filters. Stars brighter than I = 16 mag have photometric rms lower than 0.01 mag, gradually increasing to 0.1 mag for I = 20.0 mag.
Figure 2 exhibits the magnitude difference between our calibrated B, V and I magnitudes and the Stetson secondary standards as a function of V magnitude. The difference between our calibrated U magnitudes and the Kaluzny et al. (2005) data is also shown as a function of V magnitude. There are no clear systematic trends seen in the differences with V mag.
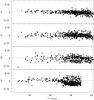 |
Fig. 2 Star-by-star comparison of our photometry with standard stars. The BVI magnitudes were compared with the Stetson catalogue, while the U filter was compared with data taken from Kaluzny et al. (2005). No clear systematics are present, which proves the reliability of our calibration procedures. |
2.1.2. Astrometric calibration
The next step is to transform X and Y coordinate to right ascension (RA) and declination (Dec). The X,Y raw positions of each star in each frame were corrected for geometric distortion using the look-up table provided in Paper I, brought into common reference frames by means of six-parameter linear transformations and averaged. To transform the averaged X and Y coordinates into RA and Dec of J2000, we used the online digitized sky ESO catalogue in skycat software as an absolute astrometric reference frame. Thanks to our accurate geometric-distortion solution and a reasonable stability of the intra-chip positions, it was possible to apply a single plate model involving linear and quadratic terms and a small but significant cubic term in each coordinate. This solution also absorbs effects caused by differential refraction but not its chromatic component. The standard error of equatorial solution is ~100 mas in each coordinate.
2.1.3. Proper motions
Proper motions were computed using V-filter images to minimize colour-dependent terms in our analysis. Moreover, our geometric-distortion solution provides the lowest residuals with V images (Paper I). A total of four images for the first epoch and six images for the second epoch were used.
First, we selected a sample of probable cluster members using the V vs. (V − I) CMD. Selected stars are located on the RGB and MS in the magnitude range 13.0 ≤ V ≤ 18.0 mag. These stars define a local reference frame to transform the positions of a given first-epoch image into positions of a second-epoch image. By adopting only stars on cluster sequences whose proper motion errors <1.5 mas yr-1, we made sure that PMs are measured relative to the bulk motion of the cluster. To minimize the effect of uncorrected distortion residuals we used the local transformation approach based on the closest 25 reference stars on the same CCD chip. No systematics larger than random errors are visible close to the corners or edges of chips.
We iteratively removed some stars from the preliminary photometric member list that had proper motions clearly inconsistent with cluster membership, even though their colours placed them near the fiducial cluster sequence. According to Pryor & Meylan (1993) the intrinsic velocity dispersion of stars in the cluster NGC 6809 is 4.9 km s-1. With a distance of 5.3 kpc (Harris 1996) the internal proper motion dispersion becomes 0.2 mas yr-1. The distribution log of proper motions errors with V mag is presented in Fig. 3 for both coordinates. The precision of the proper motion measurement (rms of individual measurement) is better than 2 mas yr-1 upto 17.5 mag in V. Errors are gradually increasing upto 7 mas yr-1 for V = 20 mag.
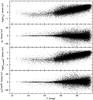 |
Fig. 3 Plots of proper motions and log of their standard deviations of the mean versus visual magnitude in mas yr-1. |
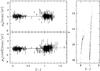 |
Fig. 4 Distribution of PMs as a function of colour for stars brighter than V < 16 mag is modelled with a linear fit. |
2.1.4. Differential chromatic refraction
Because of the wavelength dependence of the refractive index of air, a star observed with a blue filter will appear slightly higher in the sky than the same star observed through a red filter. Unfortunately, the data do not contain exposures suitable to properly correct this effect. We can, however, remove possible differences in the average differential chromatic refraction (DCR) between the two epochs.
Figure 4 shows the proper motion μαcos(δ) and μδ as a function of (V − I) colour of horizontal and giant branch stars. These selected stars are brighter than 16th mag in V and have a proper motion error ≤ 2.5 mas yr-1. We see that there is a small colour-related displacement of ~−0.81 mas yr-1 (V − I)-1 in μαcos(δ) direction. Our final proper motion data were corrected for the DCR effect by applying the colour term correction in the proper motions.
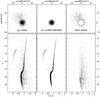 |
Fig. 5 (Top panels) Proper motion vector-point diagram. Zero point in VPD is the mean motion of cluster stars. (Bottom panels) Calibrated V vs. V − I CMD. (Left) The entire sample; (centre) stars in VPD with proper motions within 3 mas yr-1 around the cluster mean. (Right) Probable background/foreground field stars in the area of NGC 6809 studied in this paper. All plots show only stars with proper motion σ smaller than ~2.5 mas yr-1 in each coordinate. |
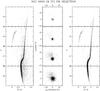 |
Fig. 6 (Left) Colour–magnitude diagram for all stars whose proper motion errors increase from 1.5 mas yr-1 for the brightest bin to 3.5 mas yr-1 for the faintest one. (Middle) Vector-point diagram for the same stars in corresponding magnitude intervals. A circle in each plot shows the adopted membership criterion. (Right) Colour–magnitude diagram for stars assumed to be cluster members. |
2.2. Cluster CMD decontamination
The vector-point diagram (VPD) of our PM measurements is shown in the top panels of Fig. 5 while V vs. (V − I) CMD in the bottom panels. Left panels show all stars while middle and right panels show the probable cluster members and field stars. A circle of 3 mas yr-1 around the cluster centroid in VPD of proper motions defines our membership criterion. The chosen radius is a compromise between losing cluster members with poor proper motions and including field stars that share the cluster mean proper motion. The shape of the cluster members’ PM dispersion is round, providing that our PM measurements are not affected by any systematics. The right lower panel represents the CMD for field stars. A few cluster members are also visible in this CMD because of their poorly determined proper motions. In Fig. 6, we show the (V − I),V CMD which is binned along the magnitude axis. In each bin we adopted different selection criteria to identify cluster members, which were more stringent for stars with more reliable measurements from data of high signal-to-noise ratio, and less restrictive for stars with less precise measurements. The proper motion error is <1.5 mas yr-1 for the brightest magnitude bin and up to 3.5 mas yr-1 for the faintest bin. This figure shows that fainter stars have a stronger error in proper motion. The bright stars from the short exposures (40 s) in epoch 2 have saturated in the long exposures (200 s) of epoch 1. The separation of brighter cluster members from the field stars is clearly visible while fainter members are not clearly separated out as seen in Fig. 6. The reason may be that proper motions for fainter stars are not determined accurately.
2.3. Comparison with previous proper motion studies
Absolute proper motion can be determined using galaxies observed in the field of NGC 6809. Few background faint galaxies are visible in our images, but they are not suitable to determine absolute proper motions because of the large error in their proper motions.
The absolute proper motions of stars brighter than V = 18 mag are available in the UCAC3 catalogue (Zacharias et al. 2010). There are 310 common stars found to be brighter than V = 18 mag. To compare our proper motions with UCAC3, we changed the UCAC3 proper motions to relative proper motions. For this, we subtracted the absolute proper motion calculated by Dinescu et al. (1999), (μαcosδ = −1.57 mas yr-1, μδ = −10.14 mas yr-1) from the individual proper motion of UCAC3. We considered the value of the absolute proper motion for the cluster by Dinescu et al. (1999) because it is more precise than the derived mean absolute proper motion using UCAC3 stars. Figure 7 shows the comparison of our PMs with those of the UCAC3 catalogue. The top-left panel shows the VPD of UCAC3 stars while the top-right panel shows the VPD of our measurements. A concentration of stars around (0, 0) mas yr-1 is seen in both VPDs. Our proper motions distribution is tighter than the UCAC3 distribution. This is because our data are more precise than the UCAC3 data.
In the lower panels of Fig. 7 we show the difference (Δ) in μαcosδ and μδ in the sense of our minus the UCAC3 difference as a function of V magnitude. There is no systematic trend in the differences with magnitude. The 3σ clipped median of differences are − 0.10(σ = 3.70) mas yr-1 and 2.60(σ = 4.45) mas yr-1 in μαcosδ and μδ.
Figure 8 shows the difference between our proper motions and Zl11 plotted with V magnitude. The 3σ clipped median of differences are − 0.28(σ = 0.86) mas yr-1 and − 0.02(σ = 0.82) mas yr-1. Clearly, our measurements are consistent with the Zl11 data for V ≤ 19 mag.
3. Determination of membership probability
Accurate membership determination is essential for additional astrophysical studies of cluster. The fundamental mathematical model set up by Vasilevskis et al. (1958) and the technique based upon the maximum likelihood principle developed by Sanders (1971) for membership determination have since been continuously refined.
An improved method for membership determination of stars in clusters based on proper motions with different observed precisions was developed by Stetson (1980) and Zhao & He (1990). Zhao & Shao (1994) then added the correlation coefficient of the field star distribution to the set of parameters describing their distribution on the sky.
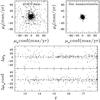 |
Fig. 7 Top panels: vector-point diagrams of common stars relative to the cluster mean motion for UCAC3 (left) and our catalogue (right). (Bottom panels) right ascension (bottom) and declination (top) proper motion differences as a function of V magnitude between UCAC3 and our measurements. Horizontal dashed lines show the 3σ-clipped median of the proper motion difference between UCAC3 and our data. |
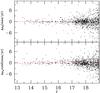 |
Fig. 8 Plot of proper motion differences between Zl11 and our data with V magnitude. Horizontal dashed lines show the 3σ-clipped median of the proper motion difference between Zl11 and our data. |
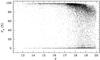 |
Fig. 9 Membership probability Pμ(%) as a function of the V magnitude for all stars in our catalogue. At V ~ 18.5 mag and fainter, Pμ diminishes as a result of increasing errors in the PMs. |
The VPD in the top left panel of Fig. 5 shows the two populations. A tight clump at μαcosδ = μδ = 0.0 mas yr-1 represents the cluster stars and a broad distribution of field stars is centred around ( − 1.71, 4.14) mas yr-1. To determine the membership probability, we adopted the method described in Balaguer-Nunez et al. (1998). This method has already been used for ω Centauri (Bellini et al. 2009). According to this method, first we constructed the frequency distribution of cluster stars  and field stars
  . The frequency function for the ith star of a cluster can be written as follows:
 ![Mathematical equation: \begin{eqnarray*} \phi_{\rm c}^{\nu} &= &\frac{1}{2\pi\sqrt{{\left(\sigma_{\rm c}^2 + \epsilon_{xi}^2\right)} {\left(\sigma_{\rm c}^2 + \epsilon_{yi}^2\right)}}}\nonumber\\[1.5mm] &&\quad\times \exp\left\{{-\frac{1}{2}\left[\frac{\left(\mu_{xi} - \mu_{xc}\right)^2}{\sigma_{\rm c}^2 + \epsilon_{xi}^2 } + \frac{\left(\mu_{yi} - \mu_{yc}\right)^2}{\sigma_{\rm c}^2 + \epsilon_{yi}^2}\right] }\right\}, \end{eqnarray*}](/articles/aa/full_html/2012/07/aa19306-12/aa19306-12-eq102.png) where μxi and μyi are the proper motions of the ith star while μxc and μyc are the cluster’s proper motion centre. σc is the intrinsic proper motion dispersion of cluster member stars and (ϵxi,ϵyi) are the observed errors in the proper motion components of ith star. The frequency distribution for ith field star is as follows:
where μxi and μyi are the proper motions of the ith star while μxc and μyc are the cluster’s proper motion centre. σc is the intrinsic proper motion dispersion of cluster member stars and (ϵxi,ϵyi) are the observed errors in the proper motion components of ith star. The frequency distribution for ith field star is as follows: ![Mathematical equation: \begin{eqnarray*} \phi_{\rm f}^{\nu} &= &\frac{1}{2\pi\sqrt{\left(1-\gamma^2\right)}\sqrt{{\left(\sigma_{xf}^2 + \epsilon_{xi}^2\right)} {\left(\sigma_{yf}^2 + \epsilon_{yi}^2\right)}}} \exp\left\{\hspace*{-1.75cm}\phantom{\frac{\left(\mu_{yi} - \mu_{yf}\right)^2}{\sigma_{yf}^2 + \epsilon_{yi}^2}}-\frac{1}{2\left(1-\gamma^2\right)}\right. \\[2.5mm] &&\quad\times \left.\left[\frac{\left(\mu_{xi} \!-\! \mu_{xf}\right)^2}{\sigma_{xf}^2 \!+\! \epsilon_{xi}^2} \!-\! \frac{2\gamma\left(\mu_{xi} \!-\! \mu_{xf}\right)\left(\mu_{yi} \!-\! \mu_{yf}\right)}{\sqrt{\left(\sigma_{xf}^2 \!+\! \epsilon_{xi}^2\right)\left(\sigma_{yf}^2 \!+\! \epsilon_{yi}^2\right)}} \!+\! \frac{\left(\mu_{yi} \!-\! \mu_{yf}\right)^2}{\sigma_{yf}^2 \!+\! \epsilon_{yi}^2}\right]\right\}, \end{eqnarray*}](/articles/aa/full_html/2012/07/aa19306-12/aa19306-12-eq109.png) where μxi and μyi are the proper motions of ith star while μxf and μyf are the field proper motion centre. ϵxi and ϵyi are the observed errors in proper motions component and σxf and σyf are the field intrinsic proper motion dispersions and γ is the correlation coefficient. γ can be calculated as
where μxi and μyi are the proper motions of ith star while μxf and μyf are the field proper motion centre. ϵxi and ϵyi are the observed errors in proper motions component and σxf and σyf are the field intrinsic proper motion dispersions and γ is the correlation coefficient. γ can be calculated as  owing to the small observed field of the cluster we did not consider the spatial distribution of the stars. To define the distribution function
  and
and  , we used stars with a proper motion error better than 6.5 mas yr-1. As expected, in the VPD, the centre of cluster stars is found to be at μxc = 0.0 mas yr-1 and μyc = 0.0 mas yr-1. Our proper motion data set could not determine intrinsic proper motion dispersion (σc) for cluster stars. Therefore, we adopted σc = 0.2 mas yr-1 as calculated in Sect. 2.1.3. For field stars, we have μxf = −1.71 mas yr-1, μyf = 4.14 mas yr-1, σxf = 4.56 mas yr-1 and σyf = 4.37 mas yr-1.
The distribution of all the stars can be calculated as 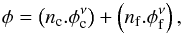 where nc and nf are the normalized number of stars for cluster and field (nc + nf = 1). Therefore, the membership probability for ith star is
  a good indicator of cluster and field separation is the membership probability. It is plotted as a function of magnitude in Fig. 9. As seen in this plot, high membership probability (Pμ > 90%) extend down to V ~ 19 mag. At fainter magnitudes the membership probability gradually decreases.
Figure 10 shows the CMD with membership probability Pμ > 80%. This CMD shows a clean main-sequence down to V ~ 20 mag and distinct population of sub-giants, red giants, horizontal branch stars, and blue stragglers.
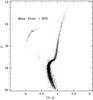 |
Fig. 10 Colour–magnitude diagram for the stars with membership probability > 80%. |
4. Applications
4.1. Membership probability of variables in NGC 6809
Our catalogue can be used to assign membership probability of many variables stars in this cluster. Olech et al. (1999) have found 15 RR Lyrae photometric variables using the data taken with 1.0 m Swope telescope at Las Campanas Observatory. One star is found in our catalogue. Its membership probability is Pμ = 77% and it is listed in Table 3. Our Pμ value shows that this star is a cluster member. NGC 6809 is known to have a large population of SX Phoenicis (SX Phe) variables, which are found in the BSS region shown in Pych et al. (2001). Out of 27, four are found in our catalogue and their membership probabilities are also listed in Table 3. All four of the SX Phe stars have a membership probability higher than 96% and are confirmed cluster members. Bassa et al. (2008) found 31 X-ray sources in the direction of NGC 6809. Out of 31 sources, 23 are found in our catalogue and are listed in Table 4. Out of these 23 sources, 18 have a membership probability higher than 68.27%. These 18 X-ray sources may be cluster members. X-ray sources CX2, CX17, CX23, and CX26 have membership probability less than 20%. Hence, they may not be cluster members. Membership probability of CX17, CX23, and CX26 is 0%, which means that they are field-region objects.
Lanzoni et al. (2007) have studied 65 blue straggler populations by using high-resolution HST and wide-field ground-based observations in ultraviolet and optical bands. Nine objects match with our catalogue and are listed in Table 4. Out of these nine, six have Pμ > 73% and three have Pμ < 40%. Hence, six blue stragglers are associated with the cluster and three may be field objects. All RR Lyrae variables, SX Phe stars, X-ray sources, and blue stragglers are shown in the colour-magnitude diagram with different symbols in Fig. 11.
The first few lines of the electronically available catalogue.
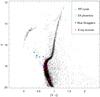 |
Fig. 11 Colour–magnitude diagram for the stars whose membership probability has been calculated. All variables, blue stragglers, and X-ray sources listed in Tables 3 and 4 are shown with different symbols indicated in the inset. |
5. The catalogue
The electronic catalogue is available at the CDS and also by request to the authors. First few lines of the electronic catalogue are given in Table 5. In the catalogue, Col. (1) contains the running number; Cols. (2) and (3) provide the J2000 equatorial coordinates in degree, while Cols. (4) and (5) provide the pixel coordinates X and Y in a distortion-corrected reference frame. Columns (6) to (13) give photometric data, i.e., U, B, V and I magnitudes and their corresponding errors. If photometry in a specific band is not available, a flag equal to 99.999 is set for the magnitude and 0.999 for the error. Columns (14) to (17) represent relative proper motions and their standard errors in mas yr-1. Column (18) gives the membership probability Pμ(%). The last Col. (19) gives the ID number of Zl11.
6. Conclusions
We provided a catalogue of precise proper motions and membership probability of stars in the wide-field region of globular
cluster NGC 6809. We have obtained precise proper motions and astrometric membership probabilities down to V ~ 20 mag in 26 × 22 arcmin2 area around the globular cluster NGC 6809. Finally, we provided the membership probability for different types of variable stars, blue stragglers, and X-ray sources. We also demonstrated that the CCD observations taken just seven years apart can provide accurate proper motions. These proper motions are used to separate the cluster members from field stars down to V ~ 20 mag.
Acknowledgments
We are grateful to the referee Floor van Leeuwen for his careful reading of the manuscript and many useful suggestions. We also thank Dr. J. Kaluzny for providing us U filter data for our calibration purpose. This research used the facilities of the Canadian Astronomy Data Centre operated by the National Research Council of Canada with the support of the Canadian Space Agency.
References
- Anderson, J., Bedin, L. R., Piotto, G., Yadav, R. K. S., & Bellini, A. 2006, A&A, 454, 1029 (Paper I) [NASA ADS] [CrossRef] [EDP Sciences] [Google Scholar]
- Bassa, C. G., Pooley, D., Verbunt, F., et al. 2008, A&A, 488, 921 [NASA ADS] [CrossRef] [EDP Sciences] [Google Scholar]
- Bellini, A., Piotto, G., Bedin, L. R., et al. 2009, A&A, 493, 959 [NASA ADS] [CrossRef] [EDP Sciences] [Google Scholar]
- Balaguer-Núñez, L., Tian, K. P., & Zhao, J. L. 1998, A&AS, 133, 387 [NASA ADS] [CrossRef] [EDP Sciences] [Google Scholar]
- Dinescu, D. I., van Altena, W. F., & Girard, T. M. 1999, AJ, 117, 277 [NASA ADS] [CrossRef] [Google Scholar]
- Harris, W. E. 1996, AJ, 112, 1487 [NASA ADS] [CrossRef] [Google Scholar]
- Kaluzny, J., Pietrukowicz, P., Thompson, I. B., et al. 2005, MNRAS, 359, 677 [NASA ADS] [CrossRef] [Google Scholar]
- Lanzoni, B., Dalessandro, E., Perina, S., et al. 2007, ApJ, 670, 1065 [NASA ADS] [CrossRef] [Google Scholar]
- Olech, A., Kaluzny, J., Thompson, I. B., et al. 1999, AJ, 118, 442 [NASA ADS] [CrossRef] [Google Scholar]
- Pryor, C., & Meylan, G. 1993, ASP Conf. Ser., 50, 357 [Google Scholar]
- Pych, W., Kaluzny, J., Krzeminski, W., Schwarzenberg-Czerny, A., & Thompson, I. B. 2001, A&A, 367, 148 [NASA ADS] [CrossRef] [EDP Sciences] [Google Scholar]
- Sanders, W. L. 1971, A&A, 14, 226 [NASA ADS] [Google Scholar]
- Stetson, P. B. 1980, AJ, 85, 387 [NASA ADS] [CrossRef] [Google Scholar]
- Vargas Álvarez, C. A., & Sandquist, E. L. 2007, AJ, 134, 825 [NASA ADS] [CrossRef] [Google Scholar]
- Vasilevskis, S., Klemola, A., & Preston, G. 1958, AJ, 63, 387 [NASA ADS] [CrossRef] [Google Scholar]
- Yadav, R. K. S., Bedin, L. R., Piotto, G., et al. 2008, A&A, 484, 609 [NASA ADS] [CrossRef] [EDP Sciences] [Google Scholar]
- Zacharias, N., Finch, C., Girard, T., et al. 2010, AJ, 139, 2184 [NASA ADS] [CrossRef] [Google Scholar]
- Zhao, J. L., & He, Y. P. 1990, A&A, 237, 54 [NASA ADS] [Google Scholar]
- Zhao, J. L., & Shao, Z. Y. 1994, A&A, 288, 89 [NASA ADS] [Google Scholar]
- Zloczewski, K., Kaluzny, J., & Thompson, I. B. 2011, MNRAS, 414, 3711 [NASA ADS] [CrossRef] [Google Scholar]
All Tables
All Figures
|
Fig. 1 Plot of the rms logarithm of the residuals around the mean magnitudes in U,B,V and I as a function of their magnitudes. |
| In the text | |
|
Fig. 2 Star-by-star comparison of our photometry with standard stars. The BVI magnitudes were compared with the Stetson catalogue, while the U filter was compared with data taken from Kaluzny et al. (2005). No clear systematics are present, which proves the reliability of our calibration procedures. |
| In the text | |
|
Fig. 3 Plots of proper motions and log of their standard deviations of the mean versus visual magnitude in mas yr-1. |
| In the text | |
|
Fig. 4 Distribution of PMs as a function of colour for stars brighter than V < 16 mag is modelled with a linear fit. |
| In the text | |
|
Fig. 5 (Top panels) Proper motion vector-point diagram. Zero point in VPD is the mean motion of cluster stars. (Bottom panels) Calibrated V vs. V − I CMD. (Left) The entire sample; (centre) stars in VPD with proper motions within 3 mas yr-1 around the cluster mean. (Right) Probable background/foreground field stars in the area of NGC 6809 studied in this paper. All plots show only stars with proper motion σ smaller than ~2.5 mas yr-1 in each coordinate. |
| In the text | |
|
Fig. 6 (Left) Colour–magnitude diagram for all stars whose proper motion errors increase from 1.5 mas yr-1 for the brightest bin to 3.5 mas yr-1 for the faintest one. (Middle) Vector-point diagram for the same stars in corresponding magnitude intervals. A circle in each plot shows the adopted membership criterion. (Right) Colour–magnitude diagram for stars assumed to be cluster members. |
| In the text | |
|
Fig. 7 Top panels: vector-point diagrams of common stars relative to the cluster mean motion for UCAC3 (left) and our catalogue (right). (Bottom panels) right ascension (bottom) and declination (top) proper motion differences as a function of V magnitude between UCAC3 and our measurements. Horizontal dashed lines show the 3σ-clipped median of the proper motion difference between UCAC3 and our data. |
| In the text | |
|
Fig. 8 Plot of proper motion differences between Zl11 and our data with V magnitude. Horizontal dashed lines show the 3σ-clipped median of the proper motion difference between Zl11 and our data. |
| In the text | |
|
Fig. 9 Membership probability Pμ(%) as a function of the V magnitude for all stars in our catalogue. At V ~ 18.5 mag and fainter, Pμ diminishes as a result of increasing errors in the PMs. |
| In the text | |
|
Fig. 10 Colour–magnitude diagram for the stars with membership probability > 80%. |
| In the text | |
|
Fig. 11 Colour–magnitude diagram for the stars whose membership probability has been calculated. All variables, blue stragglers, and X-ray sources listed in Tables 3 and 4 are shown with different symbols indicated in the inset. |
| In the text | |
Current usage metrics show cumulative count of Article Views (full-text article views including HTML views, PDF and ePub downloads, according to the available data) and Abstracts Views on Vision4Press platform.
Data correspond to usage on the plateform after 2015. The current usage metrics is available 48-96 hours after online publication and is updated daily on week days.
Initial download of the metrics may take a while.