Fig. 6
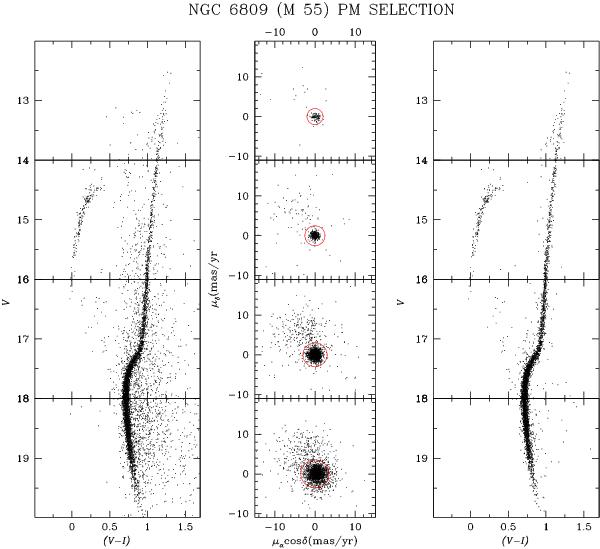
(Left) Colour–magnitude diagram for all stars whose proper motion errors increase from 1.5 mas yr-1 for the brightest bin to 3.5 mas yr-1 for the faintest one. (Middle) Vector-point diagram for the same stars in corresponding magnitude intervals. A circle in each plot shows the adopted membership criterion. (Right) Colour–magnitude diagram for stars assumed to be cluster members.
Current usage metrics show cumulative count of Article Views (full-text article views including HTML views, PDF and ePub downloads, according to the available data) and Abstracts Views on Vision4Press platform.
Data correspond to usage on the plateform after 2015. The current usage metrics is available 48-96 hours after online publication and is updated daily on week days.
Initial download of the metrics may take a while.